

Your graphics add a nice touch to my presentations and I recently used them for one of my all-hands meetings. Your toolbox adds professionalism to my slides. Instead of using standard clipart.
Claude Jones, Director of Engineer, @Walmartlabs, USA

Your graphics add a nice touch to my presentations and I recently used them for one of my all-hands meetings. Your toolbox adds professionalism to my slides. Instead of using standard clipart.
Claude Jones, Director of Engineer, @Walmartlabs, USA
I needed a fresh look at some of my slides. I've tried to find a way to create a paintbrush effect, to underline, accentuate, add some color and the handwritten markers were just the things. Very easy to use, easy to size, change the color. It was an affordable, perfect solution and I'm happy to recommend it.
Anonymous, US
The crisp, clean look of the graphics, and the fact that it allowed me to easily edit and change the colors to match the template was my main reason for purchasing them.
Brandie Jenkins, E-learning Developer, USA
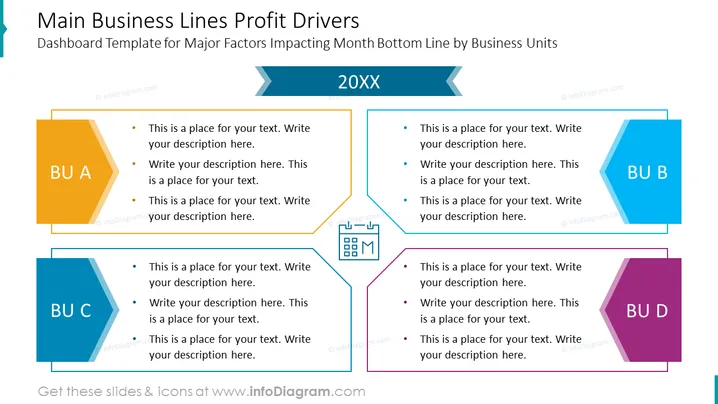
Die PowerPoint-Folie mit dem Titel „Main Business Lines Profit Drivers“ ist eine Dashboard-Vorlage, die die Hauptfaktoren veranschaulicht, die das monatliche Ergebnis nach Geschäftsbereichen beeinflussen. Sie enthält vier verschiedene Abschnitte mit den Bezeichnungen „BU A“, „BU B“, „BU C“ und „BU D“, jeweils mit drei Aufzählungspunkten, in die anpassbare Beschreibungen eingefügt werden können. Diese Abschnitte könnten verschiedene Abteilungen oder Produktlinien innerhalb eines Unternehmens darstellen, und die Aufzählungspunkte ermöglichen eine detaillierte Erklärung, wie jede Geschäftseinheit zur Gesamtrentabilität beiträgt.
Das Gesamtbild der Folie ist klar und modern, mit geometrischen Formen und einer Vielzahl von Farben, um eine visuell ansprechende Segmentierung von Informationen zu schaffen. Sie ist gut organisiert, wodurch die Unterscheidung zwischen den verschiedenen Segmenten, die von jeder Geschäftseinheit dargestellt werden, leicht fällt.



