Your graphics add a nice touch to my presentations and I recently used them for one of my all-hands meetings. Your toolbox adds professionalism to my slides. Instead of using standard clipart.
Claude Jones, Director of Engineer, @Walmartlabs, USA
Your graphics add a nice touch to my presentations and I recently used them for one of my all-hands meetings. Your toolbox adds professionalism to my slides. Instead of using standard clipart.
Claude Jones, Director of Engineer, @Walmartlabs, USA
I needed a fresh look at some of my slides. I've tried to find a way to create a paintbrush effect, to underline, accentuate, add some color and the handwritten markers were just the things. Very easy to use, easy to size, change the color. It was an affordable, perfect solution and I'm happy to recommend it.
Anonymous, US
The crisp, clean look of the graphics, and the fact that it allowed me to easily edit and change the colors to match the template was my main reason for purchasing them.
Brandie Jenkins, E-learning Developer, USA
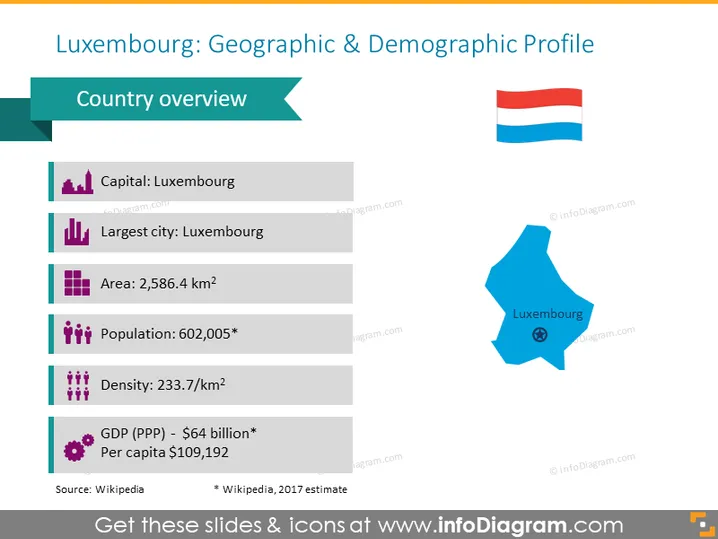
Die Bevölkerung Luxemburgs betrug am 1. Januar 2022 645.397 (52,87 % Luxemburger und 47,13 % ausländische Nationalitäten). Wikipedia
Diese Präsentationsvorlage bietet einen übersichtlichen Überblick über das demografische und geografische Profil des Landes. Sie enthält eine Karte sowie eine einfach lesbare Übersichtstabelle mit 6 unterschiedlichen Merkmalen.
Diese Folie der demografischen und geografischen Profilkarte von Luxemburg ist Teil unserer Benelux-Europakarten mit Präsentationsvorlagen für administrative Gebiete.


