

Your graphics add a nice touch to my presentations and I recently used them for one of my all-hands meetings. Your toolbox adds professionalism to my slides. Instead of using standard clipart.
Claude Jones, Director of Engineer, @Walmartlabs, USA

Your graphics add a nice touch to my presentations and I recently used them for one of my all-hands meetings. Your toolbox adds professionalism to my slides. Instead of using standard clipart.
Claude Jones, Director of Engineer, @Walmartlabs, USA
I needed a fresh look at some of my slides. I've tried to find a way to create a paintbrush effect, to underline, accentuate, add some color and the handwritten markers were just the things. Very easy to use, easy to size, change the color. It was an affordable, perfect solution and I'm happy to recommend it.
Anonymous, US
The crisp, clean look of the graphics, and the fact that it allowed me to easily edit and change the colors to match the template was my main reason for purchasing them.
Brandie Jenkins, E-learning Developer, USA
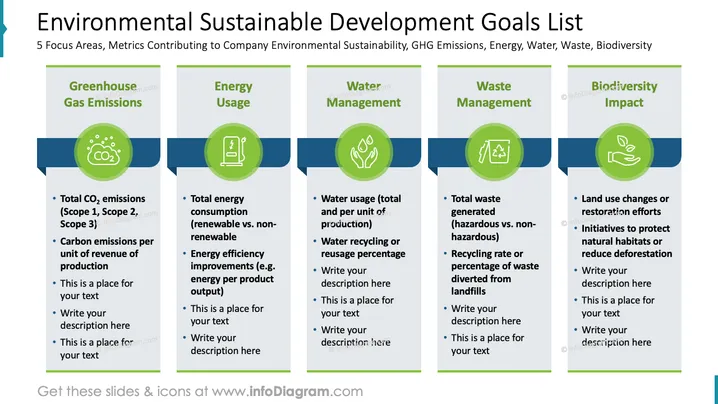
Die Folie skizziert fünf Schwerpunktbereiche, die zur ökologischen Nachhaltigkeit beitragen: Treibhausgasemissionen, Energieverbrauch, Wasserbewirtschaftung, Abfallbewirtschaftung und Biodiversitätseinfluss. Jeder Bereich enthält wichtige Kennzahlen. Treibhausgasemissionen detaillieren CO2-Werte und Kohlendioxidemissionen pro Produktionseinheit. Der Energieverbrauch konzentriert sich auf Arten des Energieverbrauchs und Effizienzverbesserungen. Die Wasserbewirtschaftung untersucht den Wasserverbrauch und das Recycling. Die Abfallbewirtschaftung berücksichtigt die Menge an erzeugtem Abfall und die Recyclingquoten. Der Biodiversitätseinfluss betrachtet Änderungen der Landnutzung und umweltfreundliche Initiativen.
Die Folie bietet einen klaren, strukturierten Überblick über die Ziele der ökologischen Nachhaltigkeit. Jeder Abschnitt ist durch konsistente Designelemente visuell voneinander unterschieden, was die Nachvollziehbarkeit erleichtert.



