

Your graphics add a nice touch to my presentations and I recently used them for one of my all-hands meetings. Your toolbox adds professionalism to my slides. Instead of using standard clipart.
Claude Jones, Director of Engineer, @Walmartlabs, USA

Your graphics add a nice touch to my presentations and I recently used them for one of my all-hands meetings. Your toolbox adds professionalism to my slides. Instead of using standard clipart.
Claude Jones, Director of Engineer, @Walmartlabs, USA
I needed a fresh look at some of my slides. I've tried to find a way to create a paintbrush effect, to underline, accentuate, add some color and the handwritten markers were just the things. Very easy to use, easy to size, change the color. It was an affordable, perfect solution and I'm happy to recommend it.
Anonymous, US
The crisp, clean look of the graphics, and the fact that it allowed me to easily edit and change the colors to match the template was my main reason for purchasing them.
Brandie Jenkins, E-learning Developer, USA
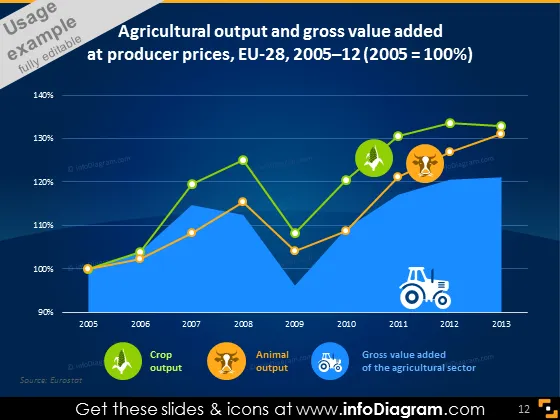
Die Folie veranschaulicht den Trend der landwirtschaftlichen Produktion und der Bruttowertschöpfung zu Erzeugerpreisen in der EU-28 von 2005 bis 2013. Die Präsentation zeigt, dass es über diesen Zeitraum hinweg einen stetigen Anstieg des Erzeugerpreisindex gibt, wobei spezifische Indikatoren wie Pflanzenproduktion, Tierproduktion und der Bruttowert des Agrarsektors im Graph dargestellt sind. Pflanzenproduktion und Tierproduktion beziehen sich jeweils auf die Produktion von Pflanzen- und Tierprodukten, während die Bruttowertschöpfung den Nettoausstoß des Sektors nach Abzug der Einsätze bezeichnet.
Das Gesamtbild der Folie ist modern und visuell ansprechend, mit einer klaren Unterscheidung zwischen verschiedenen Datensätzen durch Farbcodierung und Icons. Die Folie vermittelt komplexe Informationen in einem leicht verständlichen grafischen Format.



