

Your graphics add a nice touch to my presentations and I recently used them for one of my all-hands meetings. Your toolbox adds professionalism to my slides. Instead of using standard clipart.
Claude Jones, Director of Engineer, @Walmartlabs, USA

Your graphics add a nice touch to my presentations and I recently used them for one of my all-hands meetings. Your toolbox adds professionalism to my slides. Instead of using standard clipart.
Claude Jones, Director of Engineer, @Walmartlabs, USA
I needed a fresh look at some of my slides. I've tried to find a way to create a paintbrush effect, to underline, accentuate, add some color and the handwritten markers were just the things. Very easy to use, easy to size, change the color. It was an affordable, perfect solution and I'm happy to recommend it.
Anonymous, US
The crisp, clean look of the graphics, and the fact that it allowed me to easily edit and change the colors to match the template was my main reason for purchasing them.
Brandie Jenkins, E-learning Developer, USA
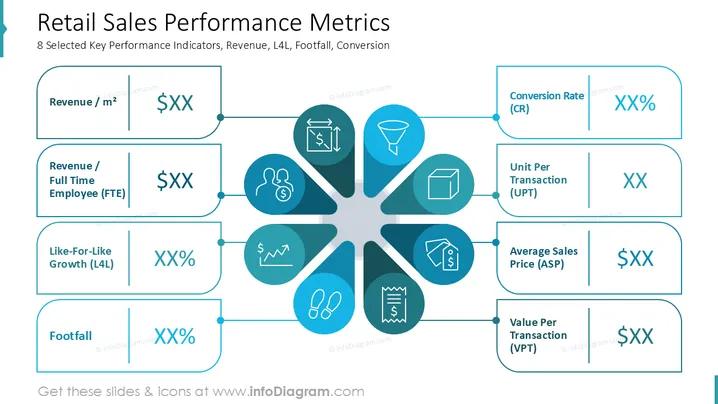
Die Folie präsentiert wichtige Leistungskennzahlen für die Leistungskennzahlen im Einzelhandel. Sie umfasst acht Kennzahlen: Umsatz pro Quadratmeter zeigt die Vertriebs-Effizienz in der Flächennutzung; Umsatz pro Vollzeitmitarbeiter misst die Produktivität der Arbeitskräfte; Vergleichbare Umsätze vergleichen aktuelle mit vorherigen Verkäufen; Kundenfrequenz erfasst die Anzahl der Geschäftebesucher; Konversionsrate bewertet das Verhältnis von Besuchern zu Käufern; Einheiten pro Transaktion zählt die durchschnittlich verkauften Artikel; Durchschnittspreis offenbart die Preisstrategie; und Wert pro Transaktion verfolgt den Umsatz pro Verkauf.
Der Gesamteindruck ist professionell und visuell ansprechend und hebt die wichtigsten Kennzahlen auf verständliche Weise hervor. Die Verwendung von Icons und Verbindungen erhöht die visuelle Ansprache.



