Your graphics add a nice touch to my presentations and I recently used them for one of my all-hands meetings. Your toolbox adds professionalism to my slides. Instead of using standard clipart.
Claude Jones, Director of Engineer, @Walmartlabs, USA
Your graphics add a nice touch to my presentations and I recently used them for one of my all-hands meetings. Your toolbox adds professionalism to my slides. Instead of using standard clipart.
Claude Jones, Director of Engineer, @Walmartlabs, USA
I needed a fresh look at some of my slides. I've tried to find a way to create a paintbrush effect, to underline, accentuate, add some color and the handwritten markers were just the things. Very easy to use, easy to size, change the color. It was an affordable, perfect solution and I'm happy to recommend it.
Anonymous, US
The crisp, clean look of the graphics, and the fact that it allowed me to easily edit and change the colors to match the template was my main reason for purchasing them.
Brandie Jenkins, E-learning Developer, USA
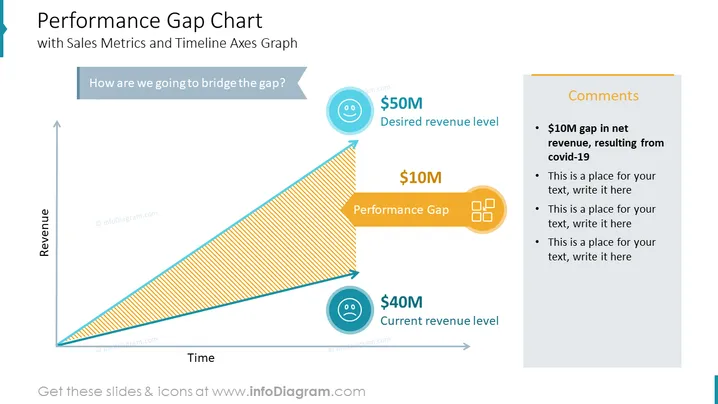
Template Deck. Sie präsentiert die Performance-Lücke zwischen Einnahmen und Zeit. Der Unterschied zwischen dem aktuellen Einnahmeniveau und dem gewünschten Einnahmeniveau wird als Performance Gap bezeichnet. Diese Präsentationsfolie erklärt, wie Sie die Lücke überbrücken werden. Schreiben Sie Ihre Ziel-Einnahmen und die Lücke zwischen Ihrer aktuellen Situation und Ihrem gewünschten zukünftigen Zustand. ## Folien-Infografikbeschreibung: Zeitachsen-Diagramm, Pfeillinien-Icon, Bearbeitbare Folie, Lächelndes Emoji-Vektor, Glücks-Icon, Kreis-Flach-Icon, Kontur-Icon, Weißes Smiley-Icon, Trauriges Emoji-Icon, Traurigkeit-Icon-Vektor, Buntes Band-Clipart, Performance- Icon, Banner-Schaltfläche mit Pfeilform, Framework-Folienvorlage


