
Your graphics add a nice touch to my presentations and I recently used them for one of my all-hands meetings. Your toolbox adds professionalism to my slides. Instead of using standard clipart.
Claude Jones, Director of Engineer, @Walmartlabs, USA

Your graphics add a nice touch to my presentations and I recently used them for one of my all-hands meetings. Your toolbox adds professionalism to my slides. Instead of using standard clipart.
Claude Jones, Director of Engineer, @Walmartlabs, USA
I needed a fresh look at some of my slides. I've tried to find a way to create a paintbrush effect, to underline, accentuate, add some color and the handwritten markers were just the things. Very easy to use, easy to size, change the color. It was an affordable, perfect solution and I'm happy to recommend it.
Anonymous, US
The crisp, clean look of the graphics, and the fact that it allowed me to easily edit and change the colors to match the template was my main reason for purchasing them.
Brandie Jenkins, E-learning Developer, USA
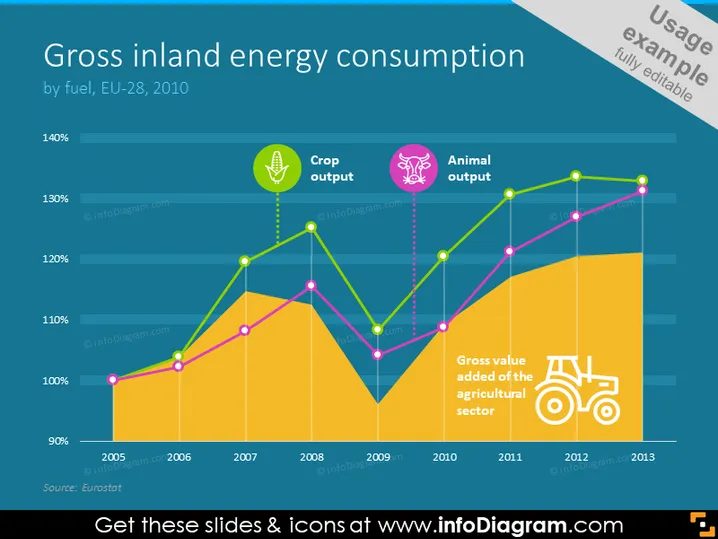
Die Folie präsentiert Daten zum "Großen Binnenenergieverbrauch nach Brennstoff, EU-28, 2010" durch ein Liniendiagramm, das drei Trends mit den Bezeichnungen "Ernteertrag", "Tierertrag" und "Bruttowertschöpfung der Landwirtschaft" zeigt. Jeder Trend hat seine eigene Linie, wobei der Ernteertrag und der Tierertrag in Pink bzw. Lila dargestellt sind und die Bruttowertschöpfung in Gelb zunimmt, was signifikante Schwankungen über die Jahre von 2005 bis 2013 anzeigt.
Die Folie ist visuell ansprechend mit ihren kontrastierenden Farben und informativen Symbolen, die schnell die Kategorien der präsentierten Daten vermitteln. Das Diagramm ist der zentrale Fokus der Folie und bietet eine klare visuelle Darstellung der Trends im Laufe der Zeit.