Your graphics add a nice touch to my presentations and I recently used them for one of my all-hands meetings. Your toolbox adds professionalism to my slides. Instead of using standard clipart.
Claude Jones, Director of Engineer, @Walmartlabs, USA
Your graphics add a nice touch to my presentations and I recently used them for one of my all-hands meetings. Your toolbox adds professionalism to my slides. Instead of using standard clipart.
Claude Jones, Director of Engineer, @Walmartlabs, USA
I needed a fresh look at some of my slides. I've tried to find a way to create a paintbrush effect, to underline, accentuate, add some color and the handwritten markers were just the things. Very easy to use, easy to size, change the color. It was an affordable, perfect solution and I'm happy to recommend it.
Anonymous, US
The crisp, clean look of the graphics, and the fact that it allowed me to easily edit and change the colors to match the template was my main reason for purchasing them.
Brandie Jenkins, E-learning Developer, USA
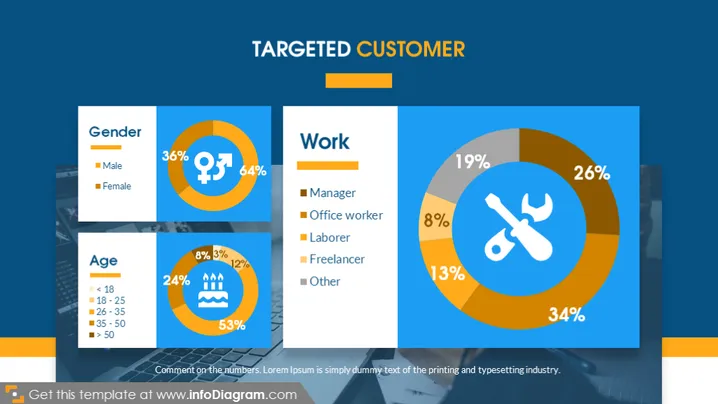
Diese PowerPoint-Folie präsentiert demografische Informationen über die Zielkunden eines Unternehmens, aufgeschlüsselt nach Geschlecht, Alter und Beruf. Der Abschnitt "Geschlecht" zeigt eine Verteilung von 64% männlich und 36% weiblich, was darauf hinweist, dass das Produkt oder die Dienstleistung häufiger von Männern genutzt wird. Der Abschnitt "Alter" zeigt, dass die größte Kundengruppe zwischen 26 und 35 Jahren alt ist, was 53% ausmacht, gefolgt von den 18-25-Jährigen (24%), was auf eine junge Erwachsenendemografie hinweist. Die Kategorie "Beruf" ist aufgeteilt in Manager (26%), Büroangestellte (19%), Arbeiter (13%), Freiberufler (34%) und Sonstige (8%), was auf eine signifikante Basis von Freiberuflern hindeutet.
Der Gesamteindruck der Folie ist professionell und klar und verwendet ein Farbschema, das demografische Segmente effektiv differenziert. Die Tortendiagramme dienen als visuelle Schwerpunkte, die gleichzeitig Daten vermitteln und die ästhetische Kohärenz beibehalten.


