

Your graphics add a nice touch to my presentations and I recently used them for one of my all-hands meetings. Your toolbox adds professionalism to my slides. Instead of using standard clipart.
Claude Jones, Director of Engineer, @Walmartlabs, USA

Your graphics add a nice touch to my presentations and I recently used them for one of my all-hands meetings. Your toolbox adds professionalism to my slides. Instead of using standard clipart.
Claude Jones, Director of Engineer, @Walmartlabs, USA
I needed a fresh look at some of my slides. I've tried to find a way to create a paintbrush effect, to underline, accentuate, add some color and the handwritten markers were just the things. Very easy to use, easy to size, change the color. It was an affordable, perfect solution and I'm happy to recommend it.
Anonymous, US
The crisp, clean look of the graphics, and the fact that it allowed me to easily edit and change the colors to match the template was my main reason for purchasing them.
Brandie Jenkins, E-learning Developer, USA
Das Bild enthält keinen klaren Folientitel, daher kann ich keinen bereitstellen.
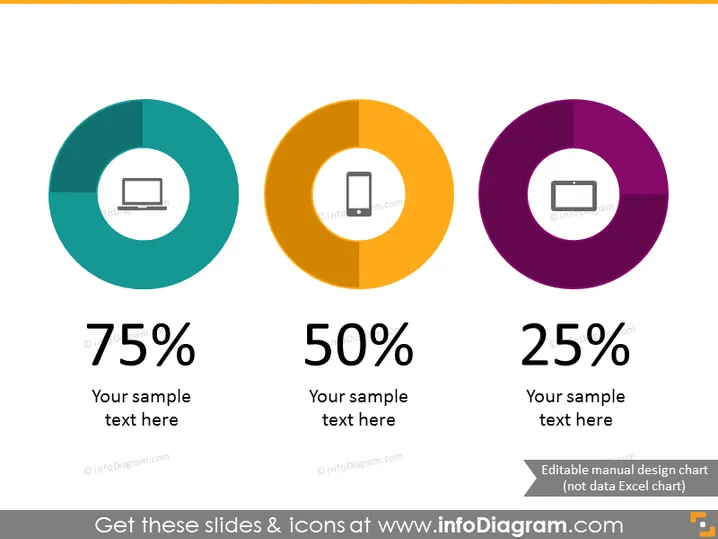
Die PowerPoint-Folien zeigen drei Donut-Diagramme, von denen jedes einen anderen Prozentsatz darstellt – 75 %, 50 % und 25 %. Jedes Diagramm hat einen Platzhalter für Text, der andeutet, dass die Prozentsätze mit verschiedenen Themen oder Kategorien verknüpft sind, die angepasst werden können. Das 75 %-Diagramm hat ein Symbol eines Laptops, was vielleicht eine technologiebezogene Statistik anzeigt. Das 50 %-Diagramm mit einem Mobiltelefon-Symbol könnte die mobile Nutzung oder den Marktanteil darstellen. Das 25 %-Diagramm mit einem Projektionsschirm könnte sich auf Präsentationen oder den Anteil an visuellen Inhalten beziehen.
Die Folie hat ein sauberes, modernes Aussehen mit einem ausgewogenen Layout, das einen einfachen Vergleich der in den Donut-Diagrammen präsentierten Daten ermöglicht. Die kontrastierenden Farben und die fettgedruckten Prozentzahlen helfen, die Aufmerksamkeit auf wichtige Informationen zu lenken.



