

Your graphics add a nice touch to my presentations and I recently used them for one of my all-hands meetings. Your toolbox adds professionalism to my slides. Instead of using standard clipart.
Claude Jones, Director of Engineer, @Walmartlabs, USA

Your graphics add a nice touch to my presentations and I recently used them for one of my all-hands meetings. Your toolbox adds professionalism to my slides. Instead of using standard clipart.
Claude Jones, Director of Engineer, @Walmartlabs, USA
I needed a fresh look at some of my slides. I've tried to find a way to create a paintbrush effect, to underline, accentuate, add some color and the handwritten markers were just the things. Very easy to use, easy to size, change the color. It was an affordable, perfect solution and I'm happy to recommend it.
Anonymous, US
The crisp, clean look of the graphics, and the fact that it allowed me to easily edit and change the colors to match the template was my main reason for purchasing them.
Brandie Jenkins, E-learning Developer, USA
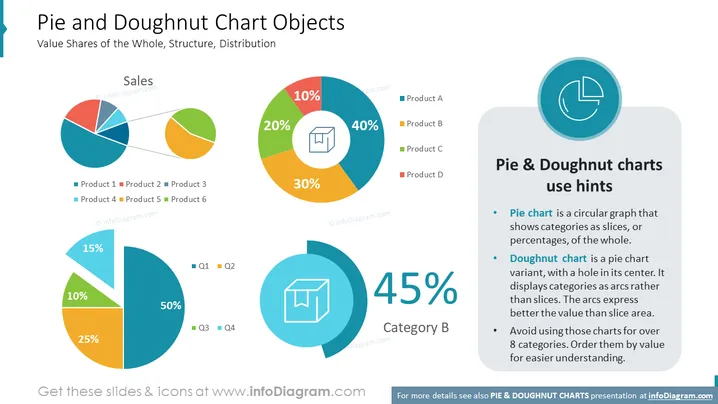
Die Folie mit dem Titel "Kreis- und Donut-Diagramm-Objekte" konzentriert sich auf die visuelle Darstellung von Daten mit Hilfe von Kreis- und Donut-Diagrammen, um die Wertanteile des Ganzen, die Struktur und die Verteilung zu zeigen. Drei unterschiedlich farbige Kreisdiagramme demonstrieren die Vertriebsverteilung unter den als Produkt 1 bis Produkt 6 bezeichneten Produkten oder Zeitabschnitten wie Q1 bis Q4. Ein großes Donut-Diagramm hebt die Dominanz von Produkt A mit 40 % hervor, gefolgt von B, C und D. Ein Textfeld gibt Verwendungshinweise für Kreis- und Donut-Diagramme, wobei die Anwendung zum Anzeigen von Kategorien als Stücke oder Bögen hervorgehoben wird, und empfiehlt, die Anzahl der Kategorien zur besseren Klarheit zu begrenzen.
Das Design der Folie ist dynamisch, wobei die Diagramme visuelles Interesse erzeugen und die sorgfältige Anordnung der Elemente eine ausgewogene Komposition schafft. Die Verwendung von Farben ist sowohl ansprechend als auch funktional und hilft bei der Differenzierung von Datenpunkten.



