

Your graphics add a nice touch to my presentations and I recently used them for one of my all-hands meetings. Your toolbox adds professionalism to my slides. Instead of using standard clipart.
Claude Jones, Director of Engineer, @Walmartlabs, USA

Your graphics add a nice touch to my presentations and I recently used them for one of my all-hands meetings. Your toolbox adds professionalism to my slides. Instead of using standard clipart.
Claude Jones, Director of Engineer, @Walmartlabs, USA
I needed a fresh look at some of my slides. I've tried to find a way to create a paintbrush effect, to underline, accentuate, add some color and the handwritten markers were just the things. Very easy to use, easy to size, change the color. It was an affordable, perfect solution and I'm happy to recommend it.
Anonymous, US
The crisp, clean look of the graphics, and the fact that it allowed me to easily edit and change the colors to match the template was my main reason for purchasing them.
Brandie Jenkins, E-learning Developer, USA
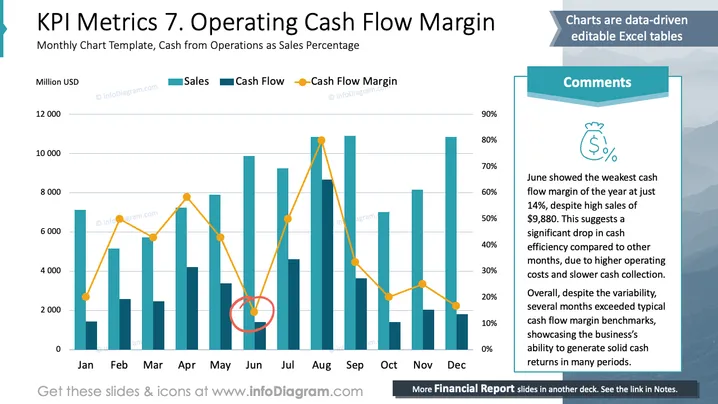
Das Diagramm veranschaulicht die Beziehung zwischen Umsatz, Cashflow und Cashflow-Margin über verschiedene Monate des Jahres. Der Umsatz, dargestellt durch türkisfarbene Balken, zeigt unterschiedliche monatliche Leistungen. Der Cashflow, in einem anderen Farbton von Türkis markiert, folgt einem ähnlichen Muster. Die Cashflow-Marge, dargestellt durch eine gelbe Linie mit Punkten, hebt den Prozentsatz des Cashflows im Verhältnis zum Umsatz hervor. Besonders auffällig ist, dass der Juni die niedrigste Cashflow-Marge aufweist, trotz hoher Umsätze, was auf eine reduzierte Cash-Effizienz hinweist.
Die Folie ist eine visuell klare Darstellung der monatlichen KPI-Metriken, die eine deutliche Farbkennung und Beschriftungen für einen einfachen Vergleich verwendet. Das Design ermöglicht eine schnelle Identifizierung von Trends und Anomalien in finanziellen Kennzahlen.



