

Your graphics add a nice touch to my presentations and I recently used them for one of my all-hands meetings. Your toolbox adds professionalism to my slides. Instead of using standard clipart.
Claude Jones, Director of Engineer, @Walmartlabs, USA

Your graphics add a nice touch to my presentations and I recently used them for one of my all-hands meetings. Your toolbox adds professionalism to my slides. Instead of using standard clipart.
Claude Jones, Director of Engineer, @Walmartlabs, USA
I needed a fresh look at some of my slides. I've tried to find a way to create a paintbrush effect, to underline, accentuate, add some color and the handwritten markers were just the things. Very easy to use, easy to size, change the color. It was an affordable, perfect solution and I'm happy to recommend it.
Anonymous, US
The crisp, clean look of the graphics, and the fact that it allowed me to easily edit and change the colors to match the template was my main reason for purchasing them.
Brandie Jenkins, E-learning Developer, USA
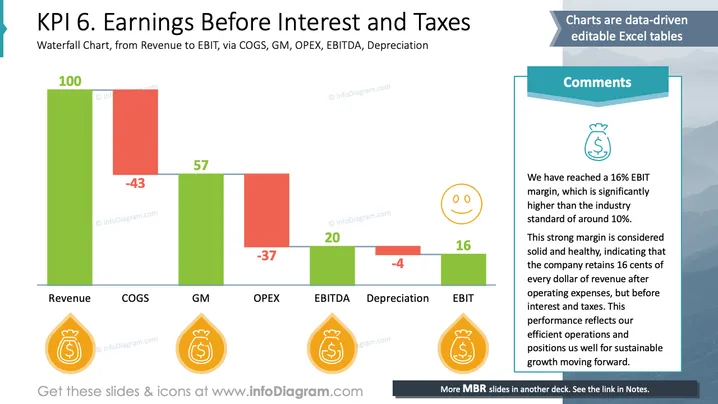
Die Folie behandelt das Konzept des Ergebnisses vor Zinsen und Steuern (EBIT) anhand eines Wasserfalldiagramms. Der Prozess beginnt mit "Umsatz" bei 100, was zu einem anfänglichen Einkommen beiträgt. "COGS", oder Kosten der verkauften Waren, reduziert das Einkommen um -43 und spiegelt die Produktionskosten wider. "GM", oder Bruttomarge, liegt bei 57 und zeigt den Gewinn vor Betriebsausgaben an. "OPEX" verringert den Gewinn weiter um -37 und zeigt die Betriebskosten. "EBITDA" ergibt 20 und spiegelt das Ergebnis vor Zinsen, Steuern, Abschreibungen und Amortisation wider. Schließlich führt "Abschreibungen" zu einer Wertminderung von -4, was zu einem "EBIT" von 16 führt, was das endgültige Ergebnis vor Zinsen und Steuern bedeutet.
Die Folie kombiniert visuelle Diagramme mit textueller Erklärung, um finanzielle Kennzahlen effektiv zu präsentieren. Der Einsatz von Farben und Icons erhöht die visuelle Ansprache und Klarheit.



