

Your graphics add a nice touch to my presentations and I recently used them for one of my all-hands meetings. Your toolbox adds professionalism to my slides. Instead of using standard clipart.
Claude Jones, Director of Engineer, @Walmartlabs, USA

Your graphics add a nice touch to my presentations and I recently used them for one of my all-hands meetings. Your toolbox adds professionalism to my slides. Instead of using standard clipart.
Claude Jones, Director of Engineer, @Walmartlabs, USA
I needed a fresh look at some of my slides. I've tried to find a way to create a paintbrush effect, to underline, accentuate, add some color and the handwritten markers were just the things. Very easy to use, easy to size, change the color. It was an affordable, perfect solution and I'm happy to recommend it.
Anonymous, US
The crisp, clean look of the graphics, and the fact that it allowed me to easily edit and change the colors to match the template was my main reason for purchasing them.
Brandie Jenkins, E-learning Developer, USA
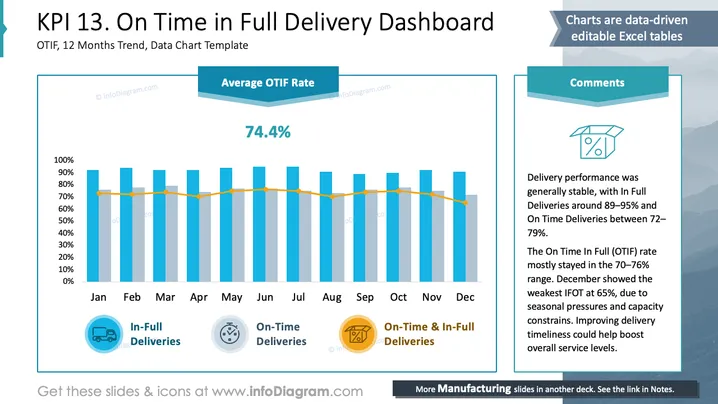
Die Folie zeigt einen 12-Monats-Trend der On-Time-In-Full (OTIF) Lieferungen, der darauf abzielt, die Lieferleistung zu analysieren. Sie zeigt, dass die Lieferung in vollem Umfang zwischen 89–95% liegt, was auf eine konsistente Bestellvollständigkeit hinweist. Die termingerechten Lieferungen schwanken zwischen 72–79%, was auf eine Variabilität in der pünktlichen Lieferung hinweist. Der gesamte OTIF-Wert liegt im Durchschnitt bei 74,4%, mit dem Hinweis, dass der Wert im Dezember aufgrund saisonaler Druck- und Kapazitätsengpässe auf 65% gefallen ist.
Die Folie vermittelt einen organisierten und datengestützten Ansatz, wobei klare Diagramme und Symbole verwendet werden, um die Kennzahlen der Lieferleistung über die Monate hinweg effektiv zu kommunizieren.



