

Your graphics add a nice touch to my presentations and I recently used them for one of my all-hands meetings. Your toolbox adds professionalism to my slides. Instead of using standard clipart.
Claude Jones, Director of Engineer, @Walmartlabs, USA

Your graphics add a nice touch to my presentations and I recently used them for one of my all-hands meetings. Your toolbox adds professionalism to my slides. Instead of using standard clipart.
Claude Jones, Director of Engineer, @Walmartlabs, USA
I needed a fresh look at some of my slides. I've tried to find a way to create a paintbrush effect, to underline, accentuate, add some color and the handwritten markers were just the things. Very easy to use, easy to size, change the color. It was an affordable, perfect solution and I'm happy to recommend it.
Anonymous, US
The crisp, clean look of the graphics, and the fact that it allowed me to easily edit and change the colors to match the template was my main reason for purchasing them.
Brandie Jenkins, E-learning Developer, USA
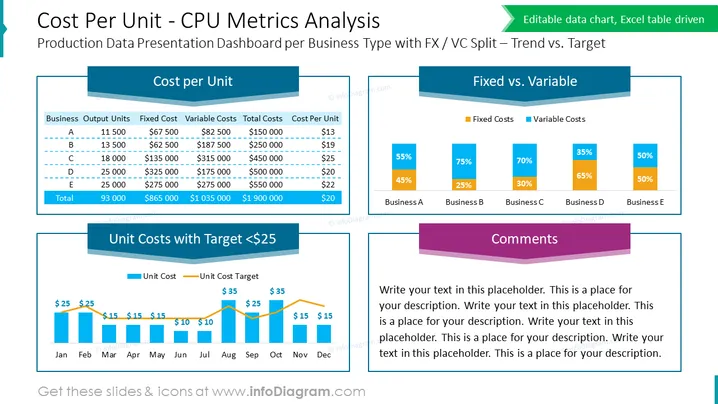
Die Folie mit dem Titel „Kosten pro Einheit – CPU-Metriken-Analyse“ konzentriert sich auf ein Präsentations-Dashboard für Produktionsdaten für Geschäftstypen mit FX-/VC-Aufteilung – Trend vs. Ziel. Sie gliedert verschiedene Kostenfaktoren in drei Hauptabschnitte. Der Abschnitt „Kosten pro Einheit“ tabeliert die Geschäftsproduktionseinheiten mit festen, variablen und Gesamtkosten, um die Kosten pro Einheit zu berechnen. Der Abschnitt „Fest vs. Variabel“ stellt einen grafischen Vergleich der festen und variablen Kosten über fünf Geschäftssegmente dar: A bis E. Schließlich ist der Abschnitt „Einheitskosten mit Ziel < $25“ ein Balken- und Liniendiagramm, das die Einheitskosten gegenüber einem festgelegten monatlichen Ziel verfolgt, mit einem abschließenden „Kommentare“-Bereich für anpassbaren Text.
Die Folie sieht professionell aus und ist für eine klare Kommunikation komplexer Kostenanalysen ausgelegt. Die Verwendung von Farbcodierung und grafischen Elementen wie Tabellen und Diagrammen erleichtert die Interpretation der Daten.



