

Your graphics add a nice touch to my presentations and I recently used them for one of my all-hands meetings. Your toolbox adds professionalism to my slides. Instead of using standard clipart.
Claude Jones, Director of Engineer, @Walmartlabs, USA

Your graphics add a nice touch to my presentations and I recently used them for one of my all-hands meetings. Your toolbox adds professionalism to my slides. Instead of using standard clipart.
Claude Jones, Director of Engineer, @Walmartlabs, USA
I needed a fresh look at some of my slides. I've tried to find a way to create a paintbrush effect, to underline, accentuate, add some color and the handwritten markers were just the things. Very easy to use, easy to size, change the color. It was an affordable, perfect solution and I'm happy to recommend it.
Anonymous, US
The crisp, clean look of the graphics, and the fact that it allowed me to easily edit and change the colors to match the template was my main reason for purchasing them.
Brandie Jenkins, E-learning Developer, USA
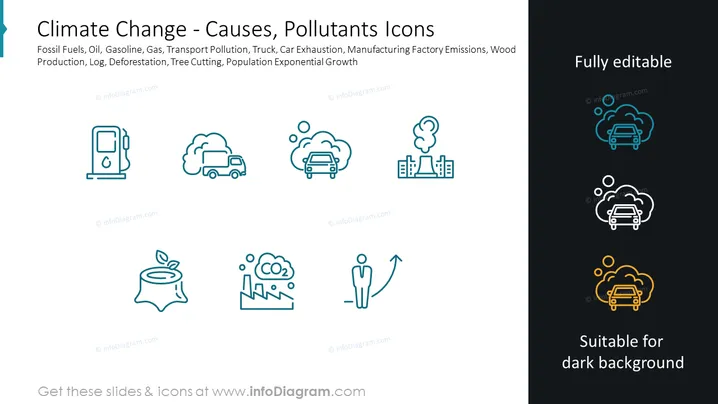
Die Folie präsentiert eine Reihe von Symbolen, die verschiedene Ursachen und Schadstoffe darstellen, die zum Klimawandel beitragen. Diese Symbole bedeuten verschiedene Emissionsquellen wie fossile Brennstoffe, Verkehr und Abholzung. Die Quellen sind aufgelistet: Fossile Brennstoffe, Öl, Benzin, Gas, Verkehrsmüll, Lkw, Autoabgase, Emissionen von Produktionsfabriken, Holzproduktion, Holz, Abholzung, Baumschneiden und exponentielles Bevölkerungswachstum. Diese Begriffe erläutern menschenverursachte Faktoren, die die Konzentrationen von Treibhausgasen verstärken und somit die globalen Klimamuster beeinflussen.
Das gesamte visuelle Design ist sauber und modern und verwendet kontrastierende Farben, um zu betonen, dass die Symbole anpassbar für verschiedene Hintergrundfarben sind. Die Symbole sind so einfach gestaltet, dass die verschiedenen Ursachen und Schadstoffe im Zusammenhang mit dem Klimawandel sofort erkannt werden können.



