

Your graphics add a nice touch to my presentations and I recently used them for one of my all-hands meetings. Your toolbox adds professionalism to my slides. Instead of using standard clipart.
Claude Jones, Director of Engineer, @Walmartlabs, USA

Your graphics add a nice touch to my presentations and I recently used them for one of my all-hands meetings. Your toolbox adds professionalism to my slides. Instead of using standard clipart.
Claude Jones, Director of Engineer, @Walmartlabs, USA
I needed a fresh look at some of my slides. I've tried to find a way to create a paintbrush effect, to underline, accentuate, add some color and the handwritten markers were just the things. Very easy to use, easy to size, change the color. It was an affordable, perfect solution and I'm happy to recommend it.
Anonymous, US
The crisp, clean look of the graphics, and the fact that it allowed me to easily edit and change the colors to match the template was my main reason for purchasing them.
Brandie Jenkins, E-learning Developer, USA
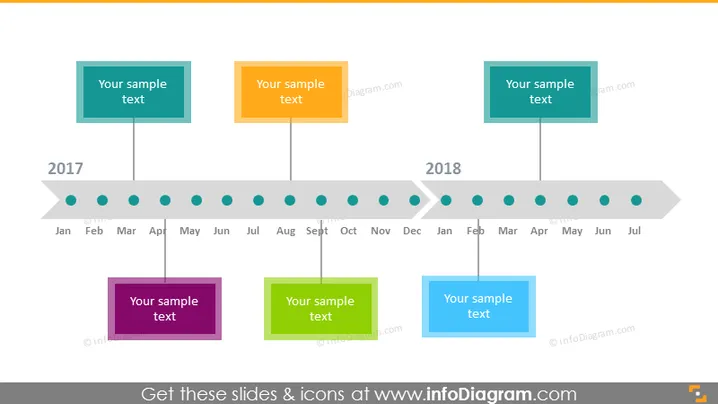
Die PowerPoint-Folie zeigt eine Zeitachse für die Jahre 2017 und 2018, unterteilt in Monate. Bestimmte Meilensteine oder Ereignisse sind auf der Zeitachse markiert, jeder dargestellt durch ein farbiges Rechteck mit Platz für Text – vermutlich zur Beschreibung wichtiger Projekte oder Ziele, die für diese Zeiten angesetzt sind. Die Anordnung deutet auf einen kontinuierlichen Fluss von Aktivitäten oder Aufgaben über zwei Jahre hin, wodurch ein visuer Zeitplan für Planungs- oder Überprüfungszwecke bereitgestellt wird.



