

Your graphics add a nice touch to my presentations and I recently used them for one of my all-hands meetings. Your toolbox adds professionalism to my slides. Instead of using standard clipart.
Claude Jones, Director of Engineer, @Walmartlabs, USA

Your graphics add a nice touch to my presentations and I recently used them for one of my all-hands meetings. Your toolbox adds professionalism to my slides. Instead of using standard clipart.
Claude Jones, Director of Engineer, @Walmartlabs, USA
I needed a fresh look at some of my slides. I've tried to find a way to create a paintbrush effect, to underline, accentuate, add some color and the handwritten markers were just the things. Very easy to use, easy to size, change the color. It was an affordable, perfect solution and I'm happy to recommend it.
Anonymous, US
The crisp, clean look of the graphics, and the fact that it allowed me to easily edit and change the colors to match the template was my main reason for purchasing them.
Brandie Jenkins, E-learning Developer, USA
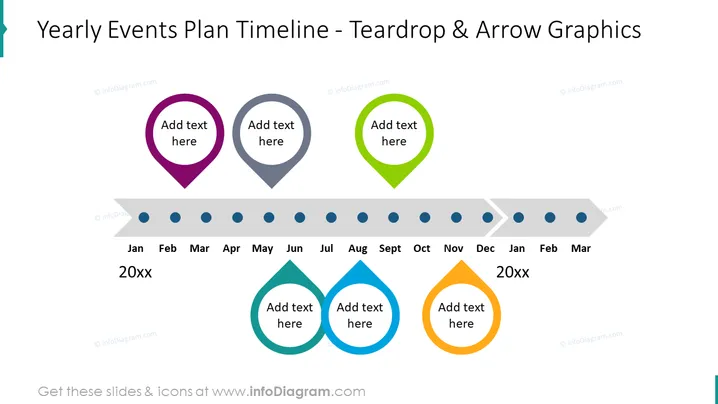
Diese PowerPoint-Folie ist dazu entworfen, eine Zeitachse für einen Jahresereignisplan mit Tropfen- und Pfeilgrafiken darzustellen. Es gibt Markierungen für jeden Monat von Januar bis März des folgenden Jahres, mit speziellen Tropfenmarkierungen für Juni, Juli und Dezember, die anzeigen, dass in diesen Monaten Ereignisse stattfinden. Benutzer können innerhalb der Tropfenformen detaillierte Texte hinzufügen. Diese Tropfenmarkierungen zeigen auf bestimmte Monate und demonstrieren die chronologische Abfolge der Ereignisse und helfen dem Publikum, sich auf diese Schlüsselpunkte im Plan zu konzentrieren.
Das visuelle Design der Folie ist klar und modern, basierend auf der Verwendung von Formen und kontrastierenden Farben, um Punkte in der Zeitachse zu differenzieren. Die Formen sind leicht identifizierbar, und das Layout erleichtert ein schnelles Verständnis der Jahresplanabfolge.



