
Your graphics add a nice touch to my presentations and I recently used them for one of my all-hands meetings. Your toolbox adds professionalism to my slides. Instead of using standard clipart.
Claude Jones, Director of Engineer, @Walmartlabs, USA
Your graphics add a nice touch to my presentations and I recently used them for one of my all-hands meetings. Your toolbox adds professionalism to my slides. Instead of using standard clipart.
Claude Jones, Director of Engineer, @Walmartlabs, USA
I needed a fresh look at some of my slides. I've tried to find a way to create a paintbrush effect, to underline, accentuate, add some color and the handwritten markers were just the things. Very easy to use, easy to size, change the color. It was an affordable, perfect solution and I'm happy to recommend it.
Anonymous, US
The crisp, clean look of the graphics, and the fact that it allowed me to easily edit and change the colors to match the template was my main reason for purchasing them.
Brandie Jenkins, E-learning Developer, USA
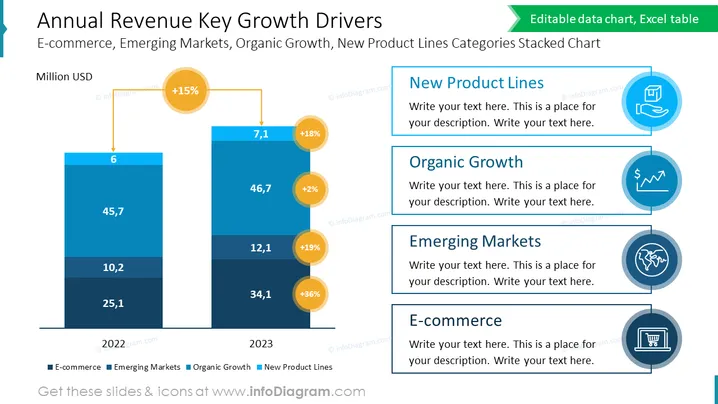
Diese Folie ist ein analytisches PowerPoint-Tool, das entwickelt wurde, um die wichtigsten Wachstumstreiber des jährlichen Umsatzes eines Unternehmens darzustellen. Sie verwendet ein gestapeltes Balkendiagramm und Prozentsteigerungsmarkierungen, um die Beiträge verschiedener Sektoren wie E-Commerce, Schwellenländer und neue Produktlinien zum finanziellen Wachstum des Unternehmens zu veranschaulichen. Ideal für strategische Geschäftsüberprüfungen oder Investorenpräsentationen, visualisiert diese Infografik-Vorlage komplexe Daten prägnant für eine klare Kommunikation.




