

Your graphics add a nice touch to my presentations and I recently used them for one of my all-hands meetings. Your toolbox adds professionalism to my slides. Instead of using standard clipart.
Claude Jones, Director of Engineer, @Walmartlabs, USA

Your graphics add a nice touch to my presentations and I recently used them for one of my all-hands meetings. Your toolbox adds professionalism to my slides. Instead of using standard clipart.
Claude Jones, Director of Engineer, @Walmartlabs, USA
I needed a fresh look at some of my slides. I've tried to find a way to create a paintbrush effect, to underline, accentuate, add some color and the handwritten markers were just the things. Very easy to use, easy to size, change the color. It was an affordable, perfect solution and I'm happy to recommend it.
Anonymous, US
The crisp, clean look of the graphics, and the fact that it allowed me to easily edit and change the colors to match the template was my main reason for purchasing them.
Brandie Jenkins, E-learning Developer, USA
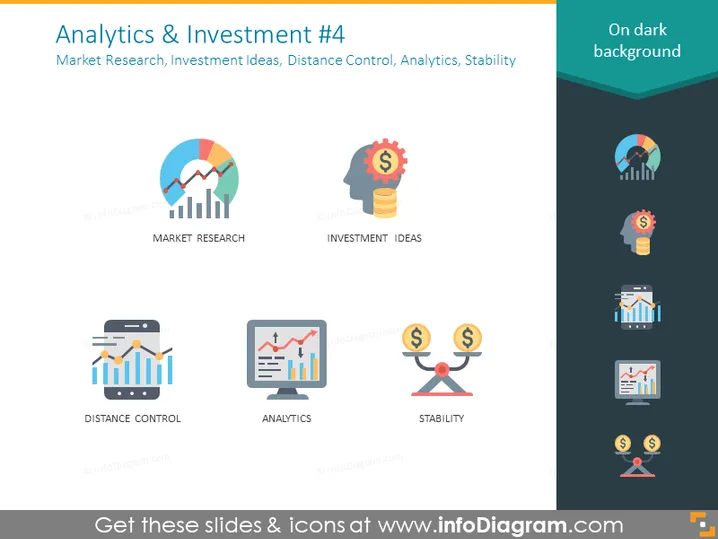
Die Folie trägt den Titel "Analytik & Investition #4" und behandelt die Konzepte Marktforschung, Investitionsideen, Distanzkontrolle, Analytik und Stabilität. Marktforschung wird typischerweise mit dem Prozess des Sammelns, Analysierens und Interpretierens von Informationen über einen Markt assoziiert, und auf der Folie wird sie durch ein Tortendiagramm dargestellt, das in ein Balkendiagramm übergeht. Investitionsideen beziehen sich wahrscheinlich auf Strategien oder Pläne zur Allokation von Ressourcen in Investitionen, dargestellt durch eine Glühbirne mit einem Dollarzeichen. Distanzkontrolle kann das Überwachen und Verwalten von Operationen aus der Ferne umfassen, angezeigt durch ein mobiles Gerät mit Signalstärkeanzeigen. Analytik beinhaltet die systematische Analyse von Daten oder Statistiken, dargestellt durch einen Computerbildschirm, der ein Diagramm anzeigt. Stabilität steht wahrscheinlich für finanzielle Stabilität, symbolisiert durch eine Wage mit Dollarzeichen.



