

Your graphics add a nice touch to my presentations and I recently used them for one of my all-hands meetings. Your toolbox adds professionalism to my slides. Instead of using standard clipart.
Claude Jones, Director of Engineer, @Walmartlabs, USA

Your graphics add a nice touch to my presentations and I recently used them for one of my all-hands meetings. Your toolbox adds professionalism to my slides. Instead of using standard clipart.
Claude Jones, Director of Engineer, @Walmartlabs, USA
I needed a fresh look at some of my slides. I've tried to find a way to create a paintbrush effect, to underline, accentuate, add some color and the handwritten markers were just the things. Very easy to use, easy to size, change the color. It was an affordable, perfect solution and I'm happy to recommend it.
Anonymous, US
The crisp, clean look of the graphics, and the fact that it allowed me to easily edit and change the colors to match the template was my main reason for purchasing them.
Brandie Jenkins, E-learning Developer, USA
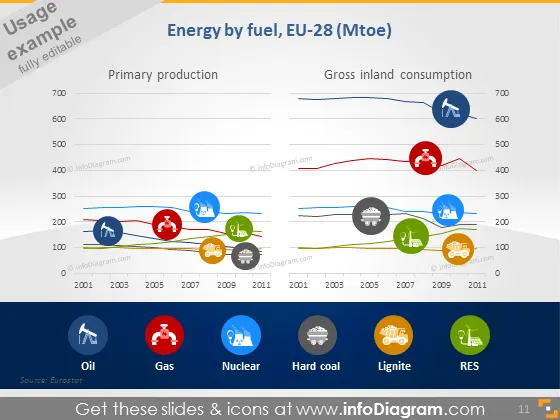
Die Folie präsentiert Daten zur Energie nach Brennstoffart in der EU-28, unterschieden zwischen Primärproduktion und Bruttoinlandsverbrauch. Sie zeigt einen Zeitstrahl von 2001 bis 2011 und zeigt Trends für Öl, Gas, Kernenergie, Steinkohle, Braunkohle und RES (Erneuerbare Energiequellen). Jeder Brennstofftyp ist durch ein Symbol und eine farblich kodierte Linie dargestellt, die die Produktions- und Verbrauchsniveaus im Laufe der Zeit anzeigt, wodurch ein visueller Vergleich der Brennstofftypen und deren Veränderungen über die Jahre hinweg ermöglicht wird.
Die Folie ist mit einem klaren und professionellen Look gestaltet, der Icons und Farbcodierungen verwendet, um komplexe Daten effektiv zu kommunizieren. Das Dual-Diagramm-Layout erleichtert den Vergleich von Produktions- und Verbrauchstrends für verschiedene Brennstofftypen.



