

Your graphics add a nice touch to my presentations and I recently used them for one of my all-hands meetings. Your toolbox adds professionalism to my slides. Instead of using standard clipart.
Claude Jones, Director of Engineer, @Walmartlabs, USA

Your graphics add a nice touch to my presentations and I recently used them for one of my all-hands meetings. Your toolbox adds professionalism to my slides. Instead of using standard clipart.
Claude Jones, Director of Engineer, @Walmartlabs, USA
I needed a fresh look at some of my slides. I've tried to find a way to create a paintbrush effect, to underline, accentuate, add some color and the handwritten markers were just the things. Very easy to use, easy to size, change the color. It was an affordable, perfect solution and I'm happy to recommend it.
Anonymous, US
The crisp, clean look of the graphics, and the fact that it allowed me to easily edit and change the colors to match the template was my main reason for purchasing them.
Brandie Jenkins, E-learning Developer, USA
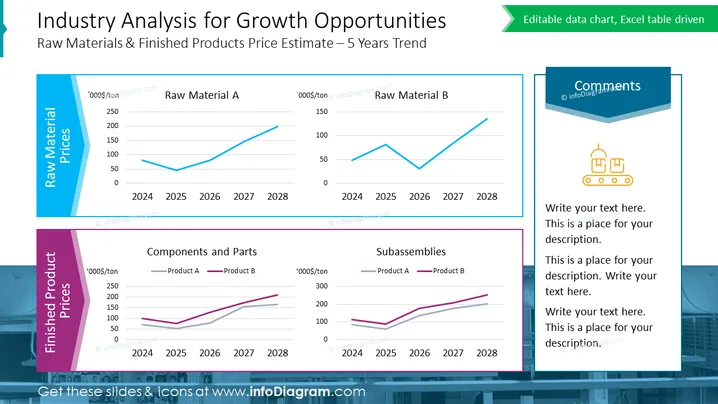
Die PowerPoint-Folie mit dem Titel „Branchenanalyse für Wachstumschancen“ vergleicht die Preistrends von Rohstoffen und Endprodukten über einen Zeitraum von fünf Jahren. Sie enthält Liniendiagramme für „Rohmaterial A“ und „Rohmaterial B“, die die voraussichtlichen Preise für jedes Jahr von 2024 bis 2028 zeigen. Zusätzlich sind Diagramme für „Komponenten und Teile“ sowie „Baugruppen“ enthalten, die ebenfalls Preisprognosen von 2024 bis 2028 zeigen. Diese visuellen Darstellungen werden von einem Abschnitt „Kommentare“ für zusätzliche Analysen oder Informationen begleitet.
Die Folie ist gut ausbalanciert und farblich abgestimmt, mit klaren Abschnitten für jeden Datensatz und beschreibenden Elementen. Die Verwendung von Farben hilft bei der Unterscheidung zwischen verschiedenen Kategorien, und der Kommentarbereich bietet Platz für kontextbezogene Informationen oder Analysen.



