
Your graphics add a nice touch to my presentations and I recently used them for one of my all-hands meetings. Your toolbox adds professionalism to my slides. Instead of using standard clipart.
Claude Jones, Director of Engineer, @Walmartlabs, USA

Your graphics add a nice touch to my presentations and I recently used them for one of my all-hands meetings. Your toolbox adds professionalism to my slides. Instead of using standard clipart.
Claude Jones, Director of Engineer, @Walmartlabs, USA

I needed a fresh look at some of my slides. I've tried to find a way to create a paintbrush effect, to underline, accentuate, add some color and the handwritten markers were just the things. Very easy to use, easy to size, change the color. It was an affordable, perfect solution and I'm happy to recommend it.
Anonymous, US
The crisp, clean look of the graphics, and the fact that it allowed me to easily edit and change the colors to match the template was my main reason for purchasing them.
Brandie Jenkins, E-learning Developer, USA
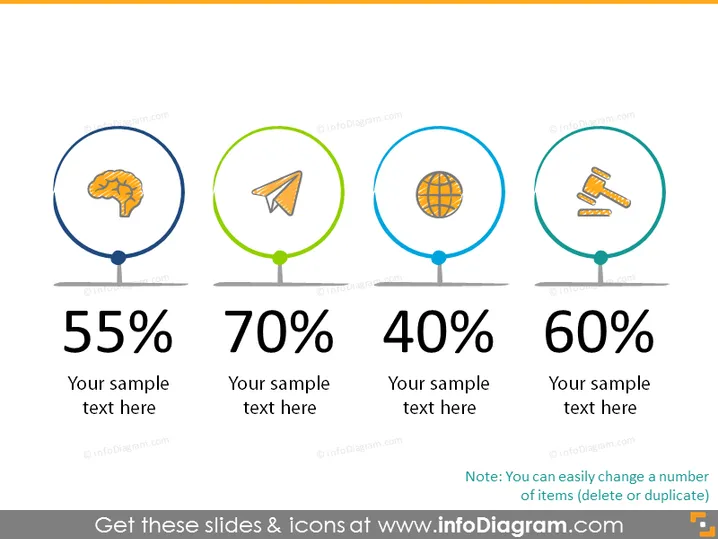
Die PowerPoint-Folie stellt eine visuelle Darstellung von vier statistischen Kennzahlen dar, die jeweils unterschiedlich umrandet und eingefärbt sind, um verschiedene Kategorien oder Themen zu symbolisieren. Die erste ist mit 55% gekennzeichnet und zeigt ein Gehirn-Icon, das auf kognitive Ergebnisse hindeutet. Die nächste zeigt 70%, begleitet von einem Papierflugzeug-Icon, das möglicherweise kommunikations- oder marketingbezogene Erfolge darstellt. Der dritte Kreis enthält ein Globus-Icon mit einer 40%-Markierung, das auf globale Reichweite oder internationale Präsenz hinweist. Schließlich gibt es eine Bewertung von 60% neben Richtergavel-Icons, die auf rechtliche oder governancebezogene Ergebnisse hinweisen. Jeder Prozentsatz wird von einem Platzhalter für zusätzlichen Text gefolgt.
Die Folie ist sauber und minimalistisch, mit einer ausgewogenen Raumnutzung, die hilft, die von jeder Statistik präsentierten Daten zu betonen. Die Farbkennzeichnung und Icons dienen sowohl einem ästhetischen als auch einem funktionalen Zweck und unterstützen die schnelle Wahrnehmung der Kategorien, zu denen jede Statistik gehört.


