

Your graphics add a nice touch to my presentations and I recently used them for one of my all-hands meetings. Your toolbox adds professionalism to my slides. Instead of using standard clipart.
Claude Jones, Director of Engineer, @Walmartlabs, USA

Your graphics add a nice touch to my presentations and I recently used them for one of my all-hands meetings. Your toolbox adds professionalism to my slides. Instead of using standard clipart.
Claude Jones, Director of Engineer, @Walmartlabs, USA
I needed a fresh look at some of my slides. I've tried to find a way to create a paintbrush effect, to underline, accentuate, add some color and the handwritten markers were just the things. Very easy to use, easy to size, change the color. It was an affordable, perfect solution and I'm happy to recommend it.
Anonymous, US
The crisp, clean look of the graphics, and the fact that it allowed me to easily edit and change the colors to match the template was my main reason for purchasing them.
Brandie Jenkins, E-learning Developer, USA
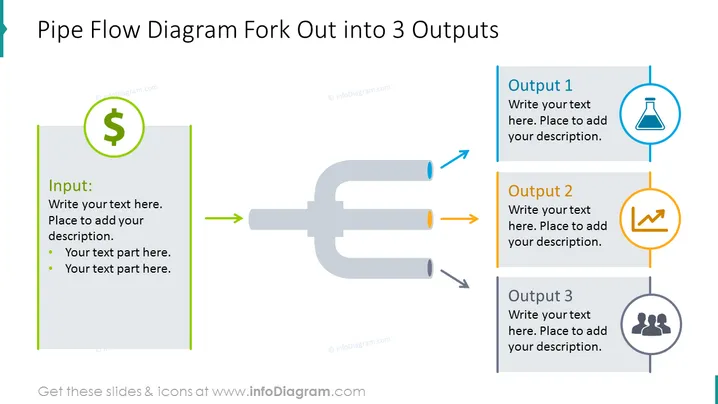
Die Folie präsentiert ein "Rohrflussdiagramm Verzweigung in 3 Ausgaben", das veranschaulicht, wie ein einzelner Input in drei separate Ausgaben unterteilt werden kann. Das Eingabefeld ist mit einem Dollarzeichen hervorgehoben, was auf einen finanziellen oder werteorientierten Input hinweist. Jede Ausgabe ist mit einem einzigartigen Symbol versehen, das den Typ des Ergebnisses oder des Bereichs darstellt, und hat Platz für eine Beschreibung. Diese visuelle Metapher könnte verwendet werden, um die Verteilung von Ressourcen oder das Ausschweifen eines Projekts oder Prozesses in mehrere Richtungen zu erklären, von denen jede ihre eigenen Merkmale und Anforderungen hat.
Die Folie hat ein sauberes, professionelles Aussehen mit einem klaren Layout, das den Input deutlich von den Ausgaben abgrenzt. Der Einsatz von Farben und Symbolen hilft, die verschiedenen Komponenten des präsentierten Prozesses zu unterscheiden.



