

Your graphics add a nice touch to my presentations and I recently used them for one of my all-hands meetings. Your toolbox adds professionalism to my slides. Instead of using standard clipart.
Claude Jones, Director of Engineer, @Walmartlabs, USA

Your graphics add a nice touch to my presentations and I recently used them for one of my all-hands meetings. Your toolbox adds professionalism to my slides. Instead of using standard clipart.
Claude Jones, Director of Engineer, @Walmartlabs, USA
I needed a fresh look at some of my slides. I've tried to find a way to create a paintbrush effect, to underline, accentuate, add some color and the handwritten markers were just the things. Very easy to use, easy to size, change the color. It was an affordable, perfect solution and I'm happy to recommend it.
Anonymous, US
The crisp, clean look of the graphics, and the fact that it allowed me to easily edit and change the colors to match the template was my main reason for purchasing them.
Brandie Jenkins, E-learning Developer, USA
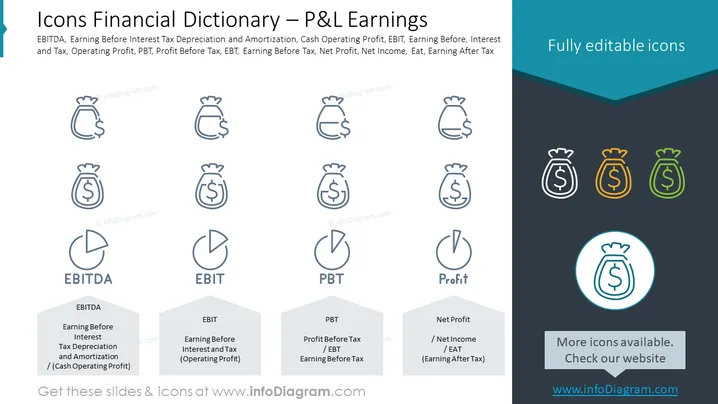
Die Folie präsentiert ein Finanzwörterbuch mit Symbolen, die verschiedene Begriffe im Zusammenhang mit Gewinn und Verlust (P&L) darstellen. EBITDA steht für Earnings Before Interest, Taxes, Depreciation, and Amortization, was die Erträge des Unternehmens unter Ausschluss dieser Kosten anzeigt. EBIT, abgekürzt für Earnings Before Interest and Taxes, repräsentiert den operativen Gewinn. PBT steht für Profit Before Tax und hebt die Erträge vor Steueraufwand hervor. EBT bezieht sich auf Earnings Before Tax. Schließlich bedeutet Nettogewinn, auch bekannt als Net Income oder EAT (Earnings After Tax), den endgültigen Gewinn nach Abzug aller Ausgaben, einschließlich Steuern.



