

Your graphics add a nice touch to my presentations and I recently used them for one of my all-hands meetings. Your toolbox adds professionalism to my slides. Instead of using standard clipart.
Claude Jones, Director of Engineer, @Walmartlabs, USA

Your graphics add a nice touch to my presentations and I recently used them for one of my all-hands meetings. Your toolbox adds professionalism to my slides. Instead of using standard clipart.
Claude Jones, Director of Engineer, @Walmartlabs, USA
I needed a fresh look at some of my slides. I've tried to find a way to create a paintbrush effect, to underline, accentuate, add some color and the handwritten markers were just the things. Very easy to use, easy to size, change the color. It was an affordable, perfect solution and I'm happy to recommend it.
Anonymous, US
The crisp, clean look of the graphics, and the fact that it allowed me to easily edit and change the colors to match the template was my main reason for purchasing them.
Brandie Jenkins, E-learning Developer, USA
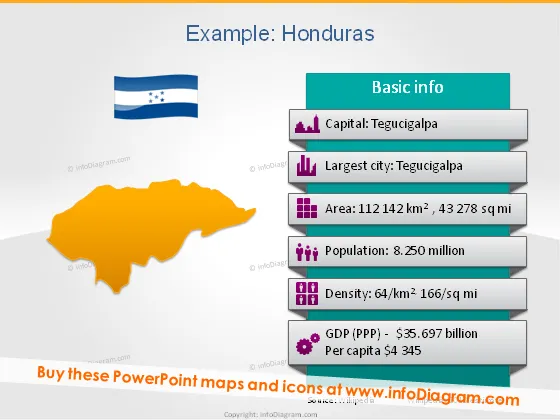
Die Folie mit dem Titel "Beispiel: Honduras" enthält grundlegende Informationen über Honduras. Die Folie listet die Hauptstadt als Tegucigalpa, die auch als größte Stadt erwähnt wird, was darauf hinweist, dass Tegucigalpa sowohl politische als auch demografische Bedeutung hat. Die Fläche Honduras wird in Quadratkilometern und Quadratmeilen angegeben; die entsprechenden Zahlen betragen 112.142 km² und 43.278 qm, was Einblick in das geografische Ausmaß des Landes bietet. Die Bevölkerung liegt bei 8,250 Millionen, was auf die Größe der Bevölkerung des Landes hinweist. Darüber hinaus werden die Bevölkerungsdichtezahlen angegeben, die zwischen Messungen in Kilometern und Meilen unterscheiden, was auf die Vertrautheit des Publikums mit verschiedenen Maßsystemen hinweisen könnte. Schließlich beträgt das Bruttoinlandsprodukt (BIP) in Kaufkraftparität (KKP) 35,697 Milliarden Dollar, mit einem Pro-Kopf-Einkommen von 4.345 Dollar, was ein Gefühl für den wirtschaftlichen Status des Landes vermittelt.
Die Folie hat ein sauberes, professionelles Aussehen mit einem Gleichgewicht von Farben und Grafiken, um die Daten leicht verdaulich zu machen. Icons werden effektiv verwendet, um sowohl visuell darzustellen.



