
Your graphics add a nice touch to my presentations and I recently used them for one of my all-hands meetings. Your toolbox adds professionalism to my slides. Instead of using standard clipart.
Claude Jones, Director of Engineer, @Walmartlabs, USA

Your graphics add a nice touch to my presentations and I recently used them for one of my all-hands meetings. Your toolbox adds professionalism to my slides. Instead of using standard clipart.
Claude Jones, Director of Engineer, @Walmartlabs, USA

I needed a fresh look at some of my slides. I've tried to find a way to create a paintbrush effect, to underline, accentuate, add some color and the handwritten markers were just the things. Very easy to use, easy to size, change the color. It was an affordable, perfect solution and I'm happy to recommend it.
Anonymous, US
The crisp, clean look of the graphics, and the fact that it allowed me to easily edit and change the colors to match the template was my main reason for purchasing them.
Brandie Jenkins, E-learning Developer, USA
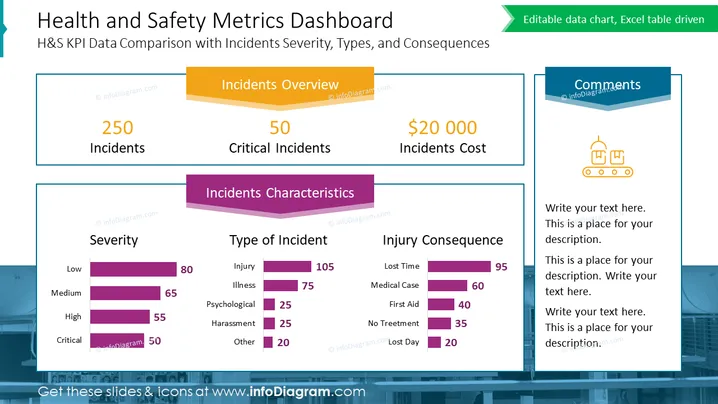
The slide presents a comprehensive "Health and Safety Metrics Dashboard" with a focus on key performance indicators (KPIs) related to incidents and safety within an organization. The slide details "H&S KPI Data Comparison with Incidents Severity, Types, and Consequences" including the total number of incidents (250), critical incidents (50), and the associated cost of these incidents ($20,000). Additionally, there's a chart titled "Incidents Characteristics" divided into three categories: Severity, with levels ranging from low to critical; Type of Incident, which includes injury, illness, psychological, harassment, and other; and Injury Consequence, detailing the impact of the incidents in terms of lost time, medical cases, and more. There is also a "Comments" section for additional notes.
The slide has a professional and clean design The use of this slide would be relevant in various professional and business contexts, such as:


