

Your graphics add a nice touch to my presentations and I recently used them for one of my all-hands meetings. Your toolbox adds professionalism to my slides. Instead of using standard clipart.
Claude Jones, Director of Engineer, @Walmartlabs, USA

Your graphics add a nice touch to my presentations and I recently used them for one of my all-hands meetings. Your toolbox adds professionalism to my slides. Instead of using standard clipart.
Claude Jones, Director of Engineer, @Walmartlabs, USA
I needed a fresh look at some of my slides. I've tried to find a way to create a paintbrush effect, to underline, accentuate, add some color and the handwritten markers were just the things. Very easy to use, easy to size, change the color. It was an affordable, perfect solution and I'm happy to recommend it.
Anonymous, US
The crisp, clean look of the graphics, and the fact that it allowed me to easily edit and change the colors to match the template was my main reason for purchasing them.
Brandie Jenkins, E-learning Developer, USA
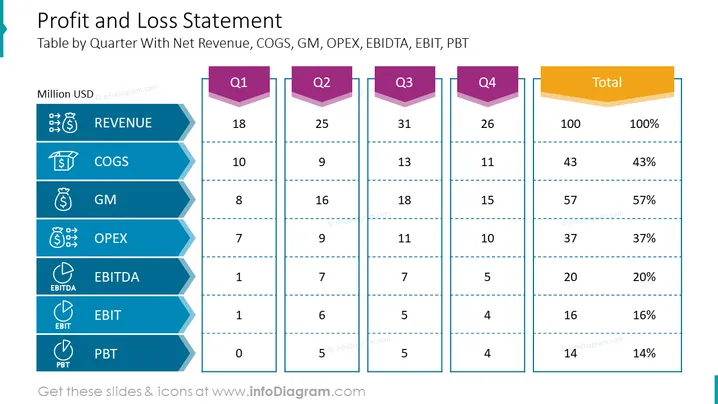
Die Folie zeigt eine detaillierte Gewinn- und Verlustrechnung, die die finanzielle Leistung pro Quartal darstellt. Sie enthält wichtige Kennzahlen wie Umsatz, COGS (Cost of Goods Sold), GM (Gross Margin), OPEX (Operating Expenses), EBITDA (Earnings Before Interest, Taxes, Depreciation, and Amortization), EBIT (Earnings Before Interest and Taxes) und PBT (Profit Before Tax), mit entsprechenden Zahlen für jedes Quartal (Q1 bis Q4) und Gesamtwerten. Jede Kennzahl ist entscheidend für die Bewertung der finanziellen Gesundheit eines Unternehmens: Der Umsatz gibt die Gesamteinnahmen an, COGS stellt die direkten Kosten der Produktion dar, GM zeigt die Rentabilität nach Abzug von COGS, OPEX steht für die Betriebskosten, und die verschiedenen EBITDA-, EBIT- und PBT-Indikatoren geben Einblicke in den Gewinn in verschiedenen Phasen der Rechnungslegung.
Die Folie ist sauber und geschäftlich, verwendet eine begrenzte Farbpalette mit Blautönen und einer kontrastierenden goldenen Farbe für die Summenspalte. Symbole, die mit jeder Metrik verbunden sind, unterstützen die visuelle Darstellung.



