

Your graphics add a nice touch to my presentations and I recently used them for one of my all-hands meetings. Your toolbox adds professionalism to my slides. Instead of using standard clipart.
Claude Jones, Director of Engineer, @Walmartlabs, USA

Your graphics add a nice touch to my presentations and I recently used them for one of my all-hands meetings. Your toolbox adds professionalism to my slides. Instead of using standard clipart.
Claude Jones, Director of Engineer, @Walmartlabs, USA
I needed a fresh look at some of my slides. I've tried to find a way to create a paintbrush effect, to underline, accentuate, add some color and the handwritten markers were just the things. Very easy to use, easy to size, change the color. It was an affordable, perfect solution and I'm happy to recommend it.
Anonymous, US
The crisp, clean look of the graphics, and the fact that it allowed me to easily edit and change the colors to match the template was my main reason for purchasing them.
Brandie Jenkins, E-learning Developer, USA
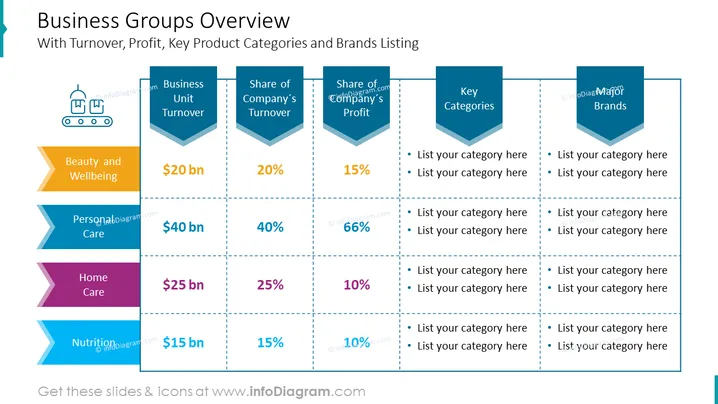
Mit Umsatz, Gewinn, wichtigen Produktkategorien und Markenlistung
Die Folie "Geschäftsbereichs-Übersicht" präsentiert eine Analyse der Geschäftseinheiten eines Unternehmens, indem sie Daten zu Umsatz, Gewinn, Produktkategorien und den mit jeder Einheit verbundenen Hauptmarken bereitstellt. Es gibt vier Hauptkategorien: Schönheit und Wohlbefinden, Körperpflege, Haushaltspflege und Ernährung. Die Folie ermöglicht die Zuordnung spezifischer Zahlen zu Umsatz jeder Einheit sowie deren jeweiligen Anteile am Unternehmensumsatz und -gewinn. Sie regt zur Auflistung wichtiger Produktkategorien und Marken unter jeder Geschäftseinheit an. Dieses strukturierte Format ermöglicht einen umfassenden Überblick darüber, wie jede Einheit zur finanziellen Gesundheit und Marktpräsenz des Unternehmens beiträgt.
Das Gesamtbild der Folie ist ein sauberer, organisierter, tabellenartiger Aufbau mit einer geschäftsmäßig-professionellen Farbpalette.



