

Your graphics add a nice touch to my presentations and I recently used them for one of my all-hands meetings. Your toolbox adds professionalism to my slides. Instead of using standard clipart.
Claude Jones, Director of Engineer, @Walmartlabs, USA

Your graphics add a nice touch to my presentations and I recently used them for one of my all-hands meetings. Your toolbox adds professionalism to my slides. Instead of using standard clipart.
Claude Jones, Director of Engineer, @Walmartlabs, USA
I needed a fresh look at some of my slides. I've tried to find a way to create a paintbrush effect, to underline, accentuate, add some color and the handwritten markers were just the things. Very easy to use, easy to size, change the color. It was an affordable, perfect solution and I'm happy to recommend it.
Anonymous, US
The crisp, clean look of the graphics, and the fact that it allowed me to easily edit and change the colors to match the template was my main reason for purchasing them.
Brandie Jenkins, E-learning Developer, USA
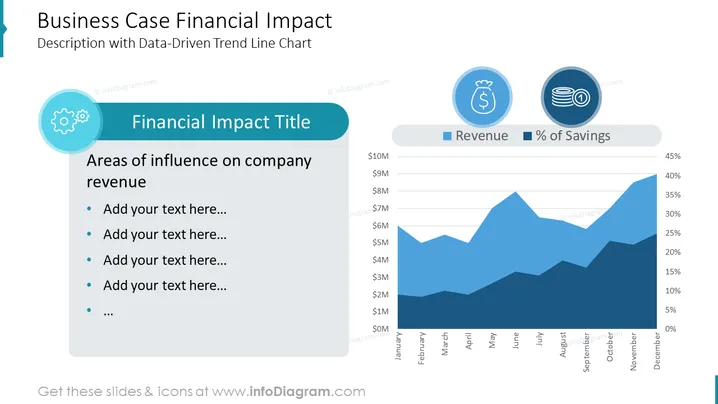
Die Folie trägt den Titel "Geschäftsszenario Finanzielle Auswirkungen" und wird beschrieben als enthalten "Beschreibung mit datengestütztem Trenddiagramm." Sie präsentiert ein Dual-Achsen-Liniendiagramm, das "Einnahmen" und "Prozentsatz der Einsparungen" über einen Zeitraum von zwölf Monaten verfolgt. Neben dem Diagramm gibt es einen Abschnitt mit der Überschrift "Titel der finanziellen Auswirkungen", der den Präsentierenden einlädt, "Einflussbereiche auf die Einnahmen des Unternehmens" aufzulisten. Es gibt Platzhaltertextpunkte, die vorschlagen, wo zusätzliche Details hinzugefügt werden können.
Die Folie hat ein professionelles und sauberes Design mit einem Farbthema, das sich um verschiedene Blautöne und Türkis zentriert. Das Diagramm ist der Mittelpunkt, ergänzt durch finanzielle Icons und koordinierte farbige Blockabschnitte für Text.



