Your graphics add a nice touch to my presentations and I recently used them for one of my all-hands meetings. Your toolbox adds professionalism to my slides. Instead of using standard clipart.
Claude Jones, Director of Engineer, @Walmartlabs, USA
Your graphics add a nice touch to my presentations and I recently used them for one of my all-hands meetings. Your toolbox adds professionalism to my slides. Instead of using standard clipart.
Claude Jones, Director of Engineer, @Walmartlabs, USA
I needed a fresh look at some of my slides. I've tried to find a way to create a paintbrush effect, to underline, accentuate, add some color and the handwritten markers were just the things. Very easy to use, easy to size, change the color. It was an affordable, perfect solution and I'm happy to recommend it.
Anonymous, US
The crisp, clean look of the graphics, and the fact that it allowed me to easily edit and change the colors to match the template was my main reason for purchasing them.
Brandie Jenkins, E-learning Developer, USA
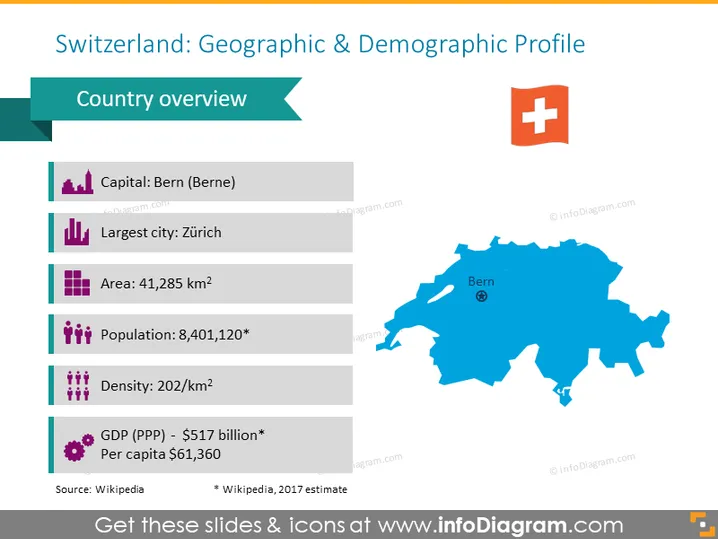
Mehr als 75 % der Bevölkerung der Schweiz leben in der zentralen Ebene, die sich zwischen den Alpen und dem Jura erstreckt und von Genf im Südwesten bis zum Hochrhein und dem Bodensee im Nordosten reicht. Im Jahr 2019 machten ausländische Bewohner im Land 25,2 % der Bevölkerung aus. Wikipedia
Haben Sie einige Fakten über die Schweiz, über die Sie selbst sprechen möchten? Verwenden Sie diese Präsentationsvorlage, um Ihre demografischen oder geografischen Informationen visuell darzustellen. Sie können die Schweiz-Karte verwenden, um einen bestimmten Ort zu kennzeichnen, und die Icons, um Ihre demografischen Informationen zu visualisieren.
Diese Schweiz Geografisches & Demografisches Profil Karte Folie ist Teil unserer Karte von Westeuropa mit Verwaltungsgebieten (Deutschland, Frankreich PPT bearbeitbare Karten).


