Your graphics add a nice touch to my presentations and I recently used them for one of my all-hands meetings. Your toolbox adds professionalism to my slides. Instead of using standard clipart.
Claude Jones, Director of Engineer, @Walmartlabs, USA
Your graphics add a nice touch to my presentations and I recently used them for one of my all-hands meetings. Your toolbox adds professionalism to my slides. Instead of using standard clipart.
Claude Jones, Director of Engineer, @Walmartlabs, USA
I needed a fresh look at some of my slides. I've tried to find a way to create a paintbrush effect, to underline, accentuate, add some color and the handwritten markers were just the things. Very easy to use, easy to size, change the color. It was an affordable, perfect solution and I'm happy to recommend it.
Anonymous, US
The crisp, clean look of the graphics, and the fact that it allowed me to easily edit and change the colors to match the template was my main reason for purchasing them.
Brandie Jenkins, E-learning Developer, USA
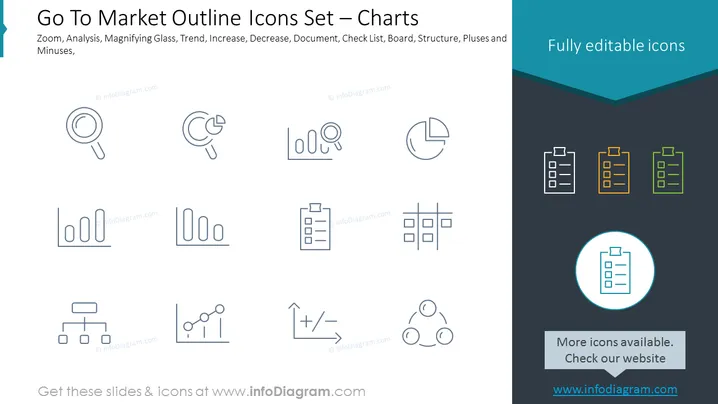
Die Folie präsentiert eine Sammlung von Umriss-Icons, die mit Go-to-Market-Strategien und Datenanalyse-Visualisierungen zusammenhängen. Diese Icons umfassen Darstellungen für Konzepte wie Zoom, Analyse, Lupe, Trend, Zunahme, Abnahme, Dokument, Checkliste, Board, Struktur, Plus und Minus. Jedes Icon ist so gestaltet, dass es ein bestimmtes Konzept oder Werkzeug, das in der Marktanalyse und strategischen Planung verwendet wird, visuell zusammenfasst. Zum Beispiel deutet das Lupe-Icon auf eine detaillierte Inspektion oder Analyse hin, während das Trend-Icon die Idee des Verfolgens von Veränderungen oder Entwicklungen im Laufe der Zeit darstellt.
Das Gesamtbild der Folie ist modern und professionell, mit einem Gleichgewicht aus einfacher Ikonografie und strategischer Platzierung, die eine klare visuelle Hierarchie schafft. Die Verwendung eines dunkelblauen Banners fügt einen subtilen Farbtupfer zum ansonsten monochromen Design hinzu.


