

Your graphics add a nice touch to my presentations and I recently used them for one of my all-hands meetings. Your toolbox adds professionalism to my slides. Instead of using standard clipart.
Claude Jones, Director of Engineer, @Walmartlabs, USA

Your graphics add a nice touch to my presentations and I recently used them for one of my all-hands meetings. Your toolbox adds professionalism to my slides. Instead of using standard clipart.
Claude Jones, Director of Engineer, @Walmartlabs, USA
I needed a fresh look at some of my slides. I've tried to find a way to create a paintbrush effect, to underline, accentuate, add some color and the handwritten markers were just the things. Very easy to use, easy to size, change the color. It was an affordable, perfect solution and I'm happy to recommend it.
Anonymous, US
The crisp, clean look of the graphics, and the fact that it allowed me to easily edit and change the colors to match the template was my main reason for purchasing them.
Brandie Jenkins, E-learning Developer, USA
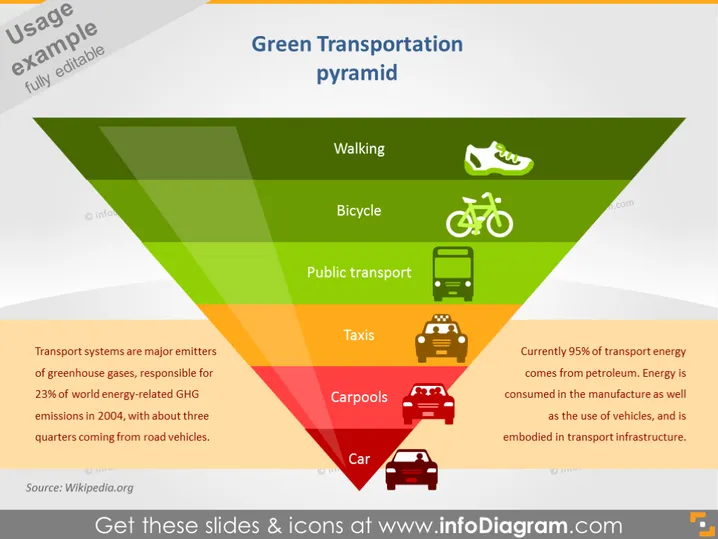
Die Folie zeigt eine grüne Verkehrspyramide, die verschiedene Transportmittel nach ihrem Umwelteinfluss kategorisiert. Zu Fuß gehen stellt die umweltfreundlichste Option dar, gefolgt von Fahrrad und öffentlichem Verkehr, was nachhaltige Entscheidungen hervorhebt. Taxis und Fahrgemeinschaften nehmen eine mittlere Position ein, was auf einen moderaten Umwelteinfluss hindeutet. Das Auto befindet sich am unteren Ende, was den höchsten ökologischen Fußabdruck anzeigt. Die zitierten Daten weisen darauf hin, dass Verkehrssysteme wichtige Treibhausgasemittenten sind und auf Erdöl für die Transportenergie angewiesen wird.
Die Pyramide ist mit einem Farbverlauf von grün an der Spitze, was die umweltfreundlichsten Methoden darstellt, bis rot an der Basis für die am wenigsten nachhaltigen gestaltet. Der strategische Einsatz von Farbcodierung und Symbolen macht die Botschaft sofort klar und visuell ansprechend.



