

Your graphics add a nice touch to my presentations and I recently used them for one of my all-hands meetings. Your toolbox adds professionalism to my slides. Instead of using standard clipart.
Claude Jones, Director of Engineer, @Walmartlabs, USA

Your graphics add a nice touch to my presentations and I recently used them for one of my all-hands meetings. Your toolbox adds professionalism to my slides. Instead of using standard clipart.
Claude Jones, Director of Engineer, @Walmartlabs, USA
I needed a fresh look at some of my slides. I've tried to find a way to create a paintbrush effect, to underline, accentuate, add some color and the handwritten markers were just the things. Very easy to use, easy to size, change the color. It was an affordable, perfect solution and I'm happy to recommend it.
Anonymous, US
The crisp, clean look of the graphics, and the fact that it allowed me to easily edit and change the colors to match the template was my main reason for purchasing them.
Brandie Jenkins, E-learning Developer, USA
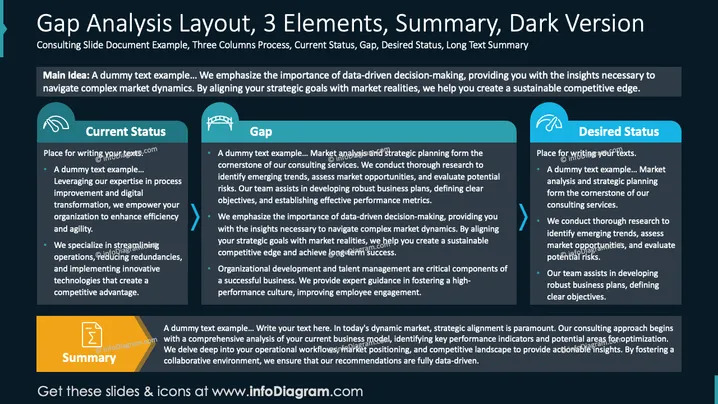
Diese Folie beschreibt den Rahmen für eine Gap-Analyse mit drei Spalten: Aktueller Status, Lücke, Gewünschter Status. "Aktueller Status" umfasst die Nutzung von Fachwissen zur Verbesserung der Effizienz der Organisation. "Lücke" hebt die Durchführung von Marktanalysen und strategischer Planung hervor, um Chancen und Risiken zu bewerten. "Gewünschter Status" beinhaltet die Entwicklung robuster Geschäftspläne, um strategische Ziele mit den Marktbedingungen für nachhaltigen Erfolg in Einklang zu bringen.
Die Folie ist visuell klar strukturiert, verwendet kontrastreiche Farben und einfache Symbole, um die Aufmerksamkeit des Betrachters durch den Analyseprozess zu lenken.



