Your graphics add a nice touch to my presentations and I recently used them for one of my all-hands meetings. Your toolbox adds professionalism to my slides. Instead of using standard clipart.
Claude Jones, Director of Engineer, @Walmartlabs, USA
Your graphics add a nice touch to my presentations and I recently used them for one of my all-hands meetings. Your toolbox adds professionalism to my slides. Instead of using standard clipart.
Claude Jones, Director of Engineer, @Walmartlabs, USA
I needed a fresh look at some of my slides. I've tried to find a way to create a paintbrush effect, to underline, accentuate, add some color and the handwritten markers were just the things. Very easy to use, easy to size, change the color. It was an affordable, perfect solution and I'm happy to recommend it.
Anonymous, US
The crisp, clean look of the graphics, and the fact that it allowed me to easily edit and change the colors to match the template was my main reason for purchasing them.
Brandie Jenkins, E-learning Developer, USA
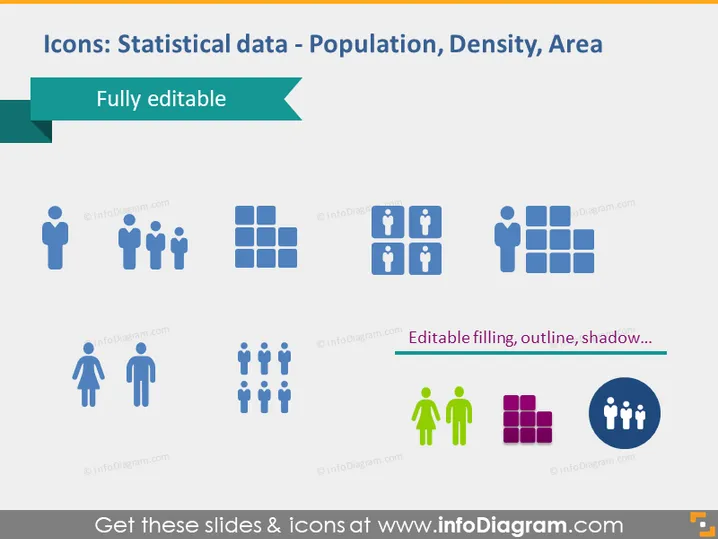
Die PowerPoint-Folie bietet eine Sammlung von Ikonen, die mit statistischen Daten in Verbindung stehen, insbesondere zur Darstellung von Bevölkerung, Dichte und Fläche. Diese Ikonen können vollständig in Bezug auf Füllung, Umriss und Schatten bearbeitet werden, was eine vielseitige Verwendung in Präsentationen ermöglicht. Es gibt Ikonen, die Einzelpersonen und Gruppen von Menschen darstellen, ein quadratisches Gitter, das die Fläche symbolisiert, und eine Familie, die die Bevölkerungsdichte repräsentiert.
Die Folie hat ein sauberes und modernes Layout mit einem konsistenten Farbschema, das hauptsächlich Blautöne, Grüntöne und einen Hauch von kontrastierendem Grün und Lila zur Betonung verwendet. Die Ikonen sind einfach und leicht erkennbar, was sie ideal zur Veranschaulichung statistischer Konzepte macht.


