
Your graphics add a nice touch to my presentations and I recently used them for one of my all-hands meetings. Your toolbox adds professionalism to my slides. Instead of using standard clipart.
Claude Jones, Director of Engineer, @Walmartlabs, USA
Your graphics add a nice touch to my presentations and I recently used them for one of my all-hands meetings. Your toolbox adds professionalism to my slides. Instead of using standard clipart.
Claude Jones, Director of Engineer, @Walmartlabs, USA
I needed a fresh look at some of my slides. I've tried to find a way to create a paintbrush effect, to underline, accentuate, add some color and the handwritten markers were just the things. Very easy to use, easy to size, change the color. It was an affordable, perfect solution and I'm happy to recommend it.
Anonymous, US
The crisp, clean look of the graphics, and the fact that it allowed me to easily edit and change the colors to match the template was my main reason for purchasing them.
Brandie Jenkins, E-learning Developer, USA
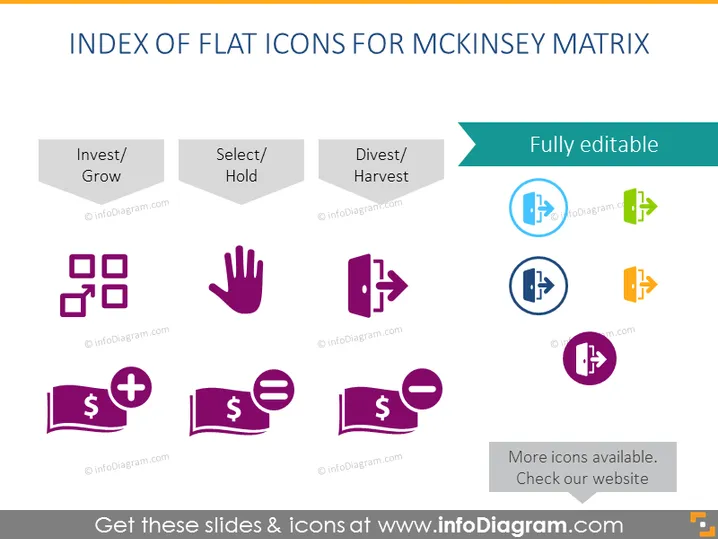
Die PowerPoint-Folie trägt den Titel "INDEX DER FLACHEN IKONEN FÜR DIE MCKINSEY MATRIX", was auf eine Sammlung von Icons hinweist, die mit dem McKinsey Matrix-Framework für die Geschäftsanalytik korrelieren. Die Folie zeigt drei Kategorien strategischer Handlungen: "Investieren/Wachsen", "Auswählen/Halten" und "Veräußern/Ernten". Unter "Investieren/Wachsen" stellen Icons Wachstum oder Expansion dar, wie Cluster von Quadraten, die Organisation oder Wachstum suggerieren. "Auswählen/Halten" zeigt ein Hand-Icon, das Auswahl oder Pause symbolisiert, während "Veräußern/Ernten" eine halbgeöffnete Tür darstellt, was Freigabe oder Abschneiden bezeichnet. Eine weitere Gruppe von Icons darunter repräsentiert finanzielle Handlungen mit Währungssymbolen, Pluszeichen und Gleichheitszeichen, wobei auf monetäre Entscheidungen hingewiesen wird, die mit den strategischen Richtungen verbunden sind.




