

Your graphics add a nice touch to my presentations and I recently used them for one of my all-hands meetings. Your toolbox adds professionalism to my slides. Instead of using standard clipart.
Claude Jones, Director of Engineer, @Walmartlabs, USA

Your graphics add a nice touch to my presentations and I recently used them for one of my all-hands meetings. Your toolbox adds professionalism to my slides. Instead of using standard clipart.
Claude Jones, Director of Engineer, @Walmartlabs, USA
I needed a fresh look at some of my slides. I've tried to find a way to create a paintbrush effect, to underline, accentuate, add some color and the handwritten markers were just the things. Very easy to use, easy to size, change the color. It was an affordable, perfect solution and I'm happy to recommend it.
Anonymous, US
The crisp, clean look of the graphics, and the fact that it allowed me to easily edit and change the colors to match the template was my main reason for purchasing them.
Brandie Jenkins, E-learning Developer, USA
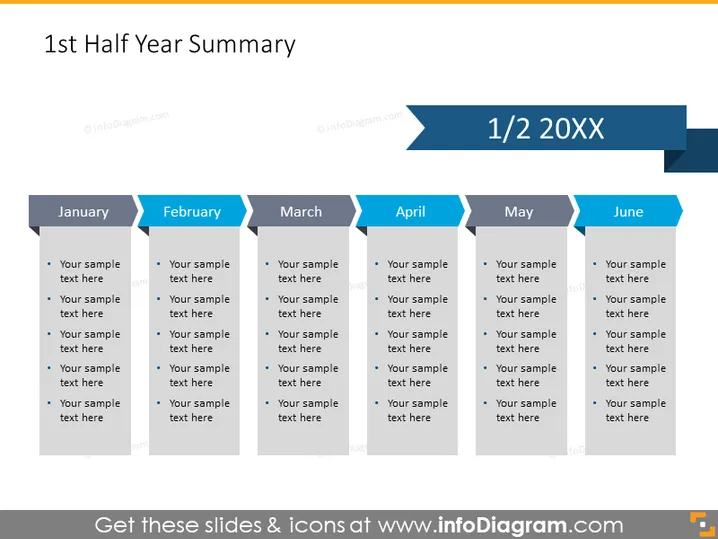
Die Folie mit dem Titel "Zusammenfassung der ersten Jahreshälfte" zeigt ein zeitliches Format für die ersten sechs Monate des Jahres, von Januar bis Juni, mit Aufzählungspunkten unter jedem Monat. Jeder Monat ist eine Kategorie, die mit spezifischem Text zu Erfolge oder Ereignisse, die in diesem Zeitraum stattfanden, gefüllt werden soll. Dieses Layout ermöglicht eine chronologische Aufschlüsselung von Daten oder Meilensteinen innerhalb von einem halben Jahr und hilft dem Publikum, die Reihenfolge und Bedeutung der berichteten Punkte zu verstehen.
Das Gesamterscheinungsbild der Folie ist sauber und professionell, mit einer Farbgestaltung, die einen guten Kontrast für die Lesbarkeit bietet. Die zeitliche Präsentation ist gut organisiert und macht es den Zuschauern leicht, dem Informationsfluss zu folgen.



