

Your graphics add a nice touch to my presentations and I recently used them for one of my all-hands meetings. Your toolbox adds professionalism to my slides. Instead of using standard clipart.
Claude Jones, Director of Engineer, @Walmartlabs, USA

Your graphics add a nice touch to my presentations and I recently used them for one of my all-hands meetings. Your toolbox adds professionalism to my slides. Instead of using standard clipart.
Claude Jones, Director of Engineer, @Walmartlabs, USA
I needed a fresh look at some of my slides. I've tried to find a way to create a paintbrush effect, to underline, accentuate, add some color and the handwritten markers were just the things. Very easy to use, easy to size, change the color. It was an affordable, perfect solution and I'm happy to recommend it.
Anonymous, US
The crisp, clean look of the graphics, and the fact that it allowed me to easily edit and change the colors to match the template was my main reason for purchasing them.
Brandie Jenkins, E-learning Developer, USA
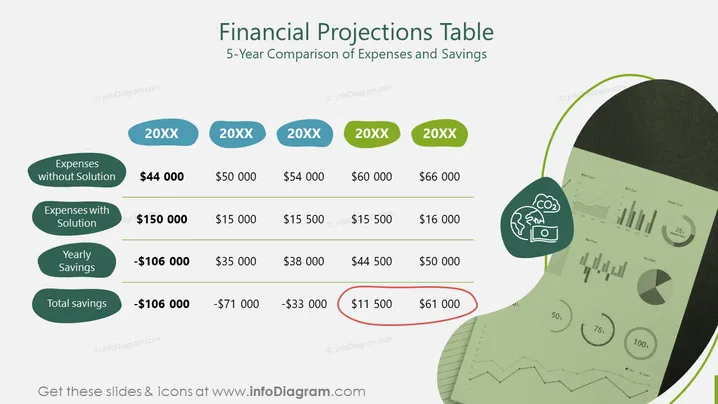
Diese Folie bietet einen 5-Jahres-Vergleich der Ausgaben und Einsparungen in einem Format einer Finanzprognosetabelle. Sie zeigt die jährlichen Kosten, die ohne eine bestimmte Lösung entstehen, im Vergleich zu den Ausgaben mit der Lösung und verdeutlicht sowohl die jährlichen Einsparungen als auch die Gesamteinsparungen über fünf Jahre. Zum Beispiel betragen im ersten Jahr die Ausgaben ohne die Lösung 44.000 $, während sie mit der Lösung auf 150.000 $ steigen, was zu einer jährlichen Einsparung von -106.000 $ führt, was einen Verlust aufgrund höherer anfänglicher Kosten bedeutet.
Die Folie zeichnet sich durch ein sauberes, organisiertes Layout mit einem hellen Hintergrund aus, der sich von den bunten grafischen Elementen abhebt. Die Verwendung von grünen und blauen Tönen deutet auf ein finanzielles oder umweltfreundliches Thema hin.



