
Your graphics add a nice touch to my presentations and I recently used them for one of my all-hands meetings. Your toolbox adds professionalism to my slides. Instead of using standard clipart.
Claude Jones, Director of Engineer, @Walmartlabs, USA
Your graphics add a nice touch to my presentations and I recently used them for one of my all-hands meetings. Your toolbox adds professionalism to my slides. Instead of using standard clipart.
Claude Jones, Director of Engineer, @Walmartlabs, USA
I needed a fresh look at some of my slides. I've tried to find a way to create a paintbrush effect, to underline, accentuate, add some color and the handwritten markers were just the things. Very easy to use, easy to size, change the color. It was an affordable, perfect solution and I'm happy to recommend it.
Anonymous, US
The crisp, clean look of the graphics, and the fact that it allowed me to easily edit and change the colors to match the template was my main reason for purchasing them.
Brandie Jenkins, E-learning Developer, USA
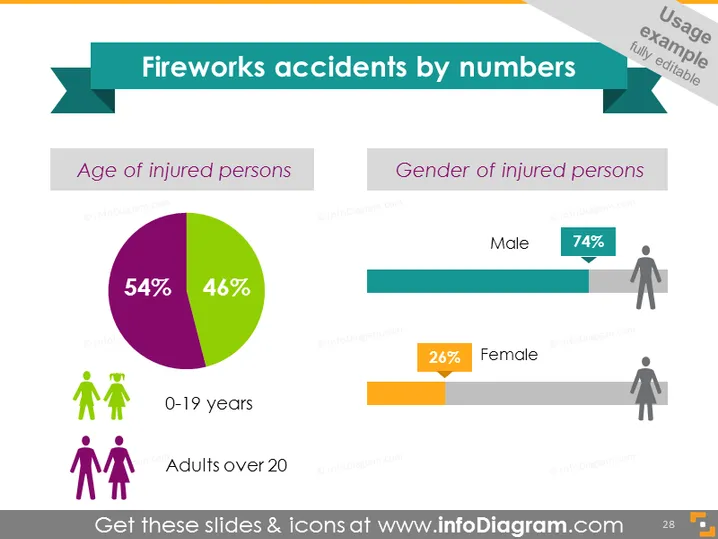
Diese Folie präsentiert statistische Daten zu Feuerwerksunfällen, kategorisiert nach Alter und Geschlecht. Der Abschnitt "Alter der verletzten Personen" zeigt ein Tortendiagramm mit zwei Kategorien: '0-19 Jahre', die 54 % der Verletzungen ausmachen, was darauf hindeutet, dass die Mehrheit der Verletzungen bei Kindern und Jugendlichen auftritt. Das andere Segment repräsentiert 'Erwachsene über 20' mit 46 %, was hervorhebt, dass fast die Hälfte der Verletzungen Erwachsene betrifft. Der Abschnitt "Geschlecht der verletzten Personen" bietet einen Balkendiagrammvergleich mit 'Männlich' bei 74 %, was eine erhebliche Diskrepanz zeigt, da Männer häufiger verletzt werden als 'Weiblich', das mit 26 % aufgeführt ist.
Die Folie ist visuell ansprechend und gut organisiert, mit klaren visuellen Darstellungen der Daten durch Grafiken und minimalem Text. Die Verwendung von Farbcodierungen und Symbolen hilft, die betroffenen demografischen Gruppen von Feuerwerksunfällen schnell zu verstehen.




