

Your graphics add a nice touch to my presentations and I recently used them for one of my all-hands meetings. Your toolbox adds professionalism to my slides. Instead of using standard clipart.
Claude Jones, Director of Engineer, @Walmartlabs, USA

Your graphics add a nice touch to my presentations and I recently used them for one of my all-hands meetings. Your toolbox adds professionalism to my slides. Instead of using standard clipart.
Claude Jones, Director of Engineer, @Walmartlabs, USA
I needed a fresh look at some of my slides. I've tried to find a way to create a paintbrush effect, to underline, accentuate, add some color and the handwritten markers were just the things. Very easy to use, easy to size, change the color. It was an affordable, perfect solution and I'm happy to recommend it.
Anonymous, US
The crisp, clean look of the graphics, and the fact that it allowed me to easily edit and change the colors to match the template was my main reason for purchasing them.
Brandie Jenkins, E-learning Developer, USA
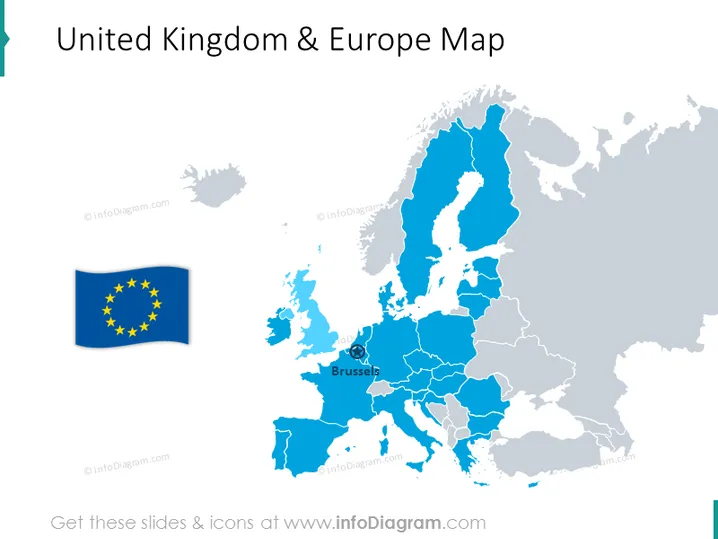
Die PowerPoint-Folie zeigt eine stilisierte Karte, die die Beziehung zwischen dem Vereinigten Königreich und Europa darstellt. Eine separate schwebende Grafik der Flagge der Europäischen Union deutet auf eine Verbindung oder Unterscheidung zwischen dem VK und dem Rest Europas hin. Die Karte könnte sich auf die geopolitische Landschaft nach dem Brexit beziehen, da das VK anders eingefärbt ist als die EU-Mitgliedstaaten. Ein Marker über Brüssel impliziert einen bestimmten Punkt von Fokus oder Bedeutung, möglicherweise das Verwaltungszentrum der Europäischen Union.
Die Folie hat ein sauberes und minimalistisches Design mit selektiver Farbverwendung, um unterschiedliche Regionen zu betonen. Die grafischen Elemente wie die EU-Flagge und das Brüssel-Symbol fügen der geografischen Darstellung kontextuelle Informationen hinzu.



