

Your graphics add a nice touch to my presentations and I recently used them for one of my all-hands meetings. Your toolbox adds professionalism to my slides. Instead of using standard clipart.
Claude Jones, Director of Engineer, @Walmartlabs, USA

Your graphics add a nice touch to my presentations and I recently used them for one of my all-hands meetings. Your toolbox adds professionalism to my slides. Instead of using standard clipart.
Claude Jones, Director of Engineer, @Walmartlabs, USA
I needed a fresh look at some of my slides. I've tried to find a way to create a paintbrush effect, to underline, accentuate, add some color and the handwritten markers were just the things. Very easy to use, easy to size, change the color. It was an affordable, perfect solution and I'm happy to recommend it.
Anonymous, US
The crisp, clean look of the graphics, and the fact that it allowed me to easily edit and change the colors to match the template was my main reason for purchasing them.
Brandie Jenkins, E-learning Developer, USA
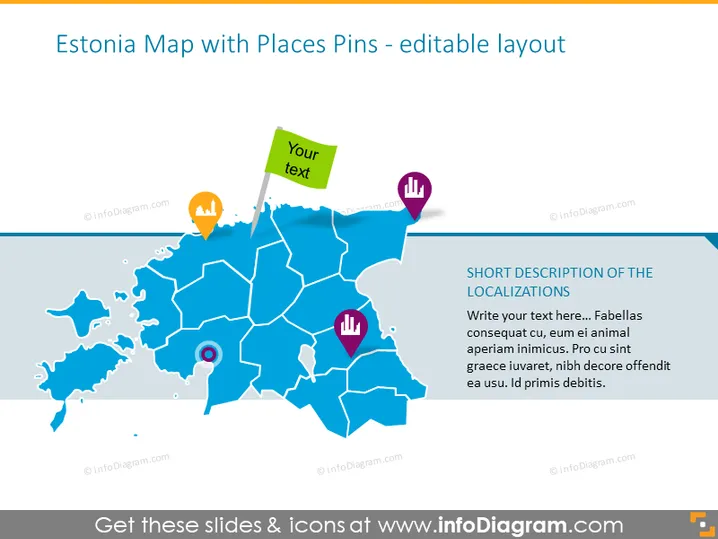
Die Folie scheint ein Visualisierungswerkzeug zur Lokalisierung spezifischer Orte in Estland zu sein. Sie enthält eine farblich kodierte Karte mit verschiedenen Ortspunkten, von denen jeder unterschiedliche Icons hat, was auf einen Mechanismus zur Kategorisierung verschiedener Arten von Interessenspunkten oder Datenhinweisen hindeutet. Jeder Pin ist dazu entworfen, eine Textbeschreibung zu begleiten, die Informationen über die einzelnen Standorte bereitstellt. Die Folie hat Platzhaltertext für eine kurze Beschreibung, was darauf hinweist, dass es sich um eine Vorlage handelt, die bereit ist, mit tatsächlichen Daten angepasst zu werden.
Die Folie hat ein sauberes, professionelles Design mit einer modernen Ästhetik. Die Farb- und Iconauswahl schafft eine intuitive und visuell ansprechende Benutzeroberfläche für die Präsentation von Daten.



