

Your graphics add a nice touch to my presentations and I recently used them for one of my all-hands meetings. Your toolbox adds professionalism to my slides. Instead of using standard clipart.
Claude Jones, Director of Engineer, @Walmartlabs, USA

Your graphics add a nice touch to my presentations and I recently used them for one of my all-hands meetings. Your toolbox adds professionalism to my slides. Instead of using standard clipart.
Claude Jones, Director of Engineer, @Walmartlabs, USA
I needed a fresh look at some of my slides. I've tried to find a way to create a paintbrush effect, to underline, accentuate, add some color and the handwritten markers were just the things. Very easy to use, easy to size, change the color. It was an affordable, perfect solution and I'm happy to recommend it.
Anonymous, US
The crisp, clean look of the graphics, and the fact that it allowed me to easily edit and change the colors to match the template was my main reason for purchasing them.
Brandie Jenkins, E-learning Developer, USA
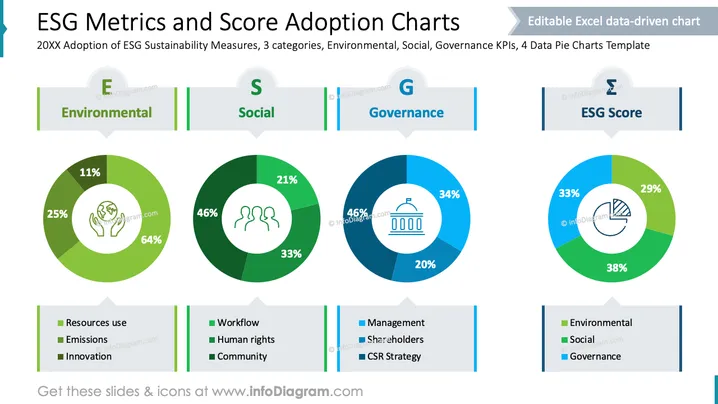
Die Folie präsentiert ESG (Umwelt, Soziales, Unternehmensführung) Metriken anhand von Tortendiagrammen, um die Übernahme von Nachhaltigkeitsmaßnahmen in drei Kategorien zu veranschaulichen. Der Umweltbereich umfasst Aspekte wie Ressourcennutzung, Emissionen und Innovation mit den jeweiligen Beiträgen. Der soziale Bereich diskutiert Arbeitsabläufe, Menschenrechte und Auswirkungen auf die Gemeinschaft. Die Unternehmensführung behandelt Management, Aktionärsbeziehungen und Strategien zur sozialen Verantwortung von Unternehmen. Ein Gesamter ESG-Score wird basierend auf diesen Kategorien generiert.
Die visuellen Elemente der Folie sind sauber und nutzen effektiv Farbcodierung und Symbole, um jeden ESG-Bereich zu unterscheiden. Dieses leicht verständliche Design unterstützt das klare Verständnis der Daten und verbessert das Verständnis der ESG-Metriken.



