

Your graphics add a nice touch to my presentations and I recently used them for one of my all-hands meetings. Your toolbox adds professionalism to my slides. Instead of using standard clipart.
Claude Jones, Director of Engineer, @Walmartlabs, USA

Your graphics add a nice touch to my presentations and I recently used them for one of my all-hands meetings. Your toolbox adds professionalism to my slides. Instead of using standard clipart.
Claude Jones, Director of Engineer, @Walmartlabs, USA
I needed a fresh look at some of my slides. I've tried to find a way to create a paintbrush effect, to underline, accentuate, add some color and the handwritten markers were just the things. Very easy to use, easy to size, change the color. It was an affordable, perfect solution and I'm happy to recommend it.
Anonymous, US
The crisp, clean look of the graphics, and the fact that it allowed me to easily edit and change the colors to match the template was my main reason for purchasing them.
Brandie Jenkins, E-learning Developer, USA
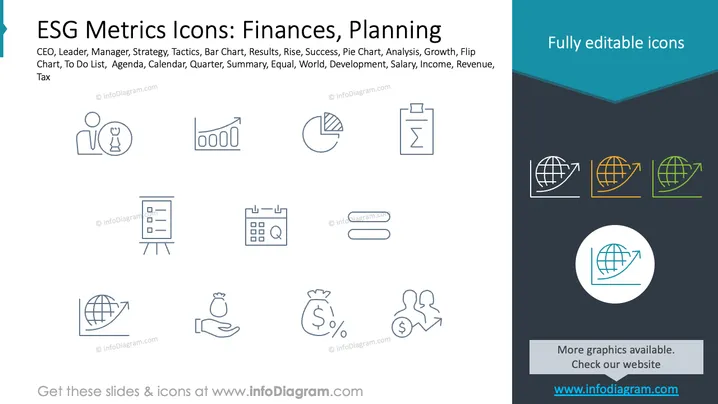
Diese Folie bietet eine Sammlung von Ikonen im Zusammenhang mit ESG-Metriken, die sich auf finanzielle und planungstechnische Aspekte konzentriert. Sie beinhaltet Symbole für CEO, Führungskraft und Manager, die Rollen im Geschäft hervorheben. Icons wie Strategie und Taktik repräsentieren Planungsmethoden. Balkendiagramm, Tortendiagramm und Analyse zeigen Datenvisualisierung und -untersuchung an. Wachstum und Erfolg verkörpern die Unternehmensentwicklung, während Kalender und Agenda bei der Terminplanung helfen. Zusammenfassung, Welt und Entwicklung deuten auf globale Berichterstattung oder Projektübersichten hin. Schließlich sind Steuer und Einnahmen wesentliche fiskalische Elemente.
Der Gesamtlook ist klar und professionell, designed für Klarheit und Verständlichkeit. Der Einsatz minimalistisch gestalteter Ikonen verbessert das Verständnis, ohne den Betrachter zu überwältigen.



