

Your graphics add a nice touch to my presentations and I recently used them for one of my all-hands meetings. Your toolbox adds professionalism to my slides. Instead of using standard clipart.
Claude Jones, Director of Engineer, @Walmartlabs, USA

Your graphics add a nice touch to my presentations and I recently used them for one of my all-hands meetings. Your toolbox adds professionalism to my slides. Instead of using standard clipart.
Claude Jones, Director of Engineer, @Walmartlabs, USA
I needed a fresh look at some of my slides. I've tried to find a way to create a paintbrush effect, to underline, accentuate, add some color and the handwritten markers were just the things. Very easy to use, easy to size, change the color. It was an affordable, perfect solution and I'm happy to recommend it.
Anonymous, US
The crisp, clean look of the graphics, and the fact that it allowed me to easily edit and change the colors to match the template was my main reason for purchasing them.
Brandie Jenkins, E-learning Developer, USA
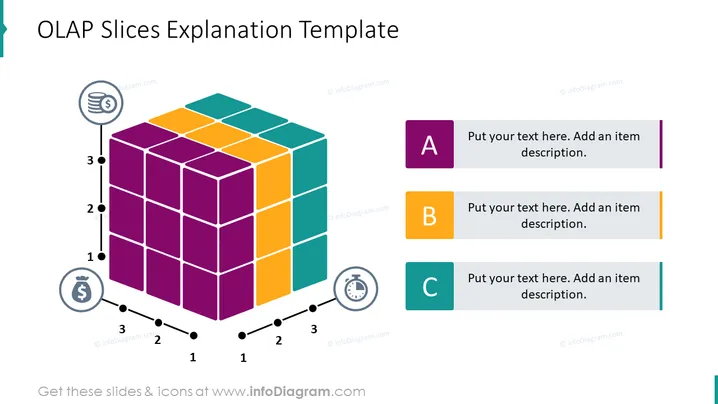
Die PowerPoint-Folie mit dem Titel "OLAP-Slices Erklärungsvorlage" bietet wahrscheinlich einen Überblick darüber, wie OLAP (Online Analytical Processing) Daten in Slices organisiert werden, um eine einfache Analyse zu ermöglichen. Der Würfel repräsentiert multidimensionale Daten, während die beschrifteten Abschnitte – A, B und C – jeweils Platz für erläuternden Text haben. Dies deutet darauf hin, dass die Folie dazu gedacht ist, dem Publikum zu helfen, spezifische Teile oder Dimensionen des OLAP-Daten-Slicings zu verstehen.
Die Folie präsentiert ein sauberes und visuell ansprechendes Format mit einem gut organisierten Layout, das Grafiken und Text effizient ausbalanciert. Der Einsatz lebhafter Farben und klarer Beschriftungen unterstützt die Betonung der entscheidenden Elemente des OLAP-Konzepts.



