Your graphics add a nice touch to my presentations and I recently used them for one of my all-hands meetings. Your toolbox adds professionalism to my slides. Instead of using standard clipart.
Claude Jones, Director of Engineer, @Walmartlabs, USA
Your graphics add a nice touch to my presentations and I recently used them for one of my all-hands meetings. Your toolbox adds professionalism to my slides. Instead of using standard clipart.
Claude Jones, Director of Engineer, @Walmartlabs, USA
I needed a fresh look at some of my slides. I've tried to find a way to create a paintbrush effect, to underline, accentuate, add some color and the handwritten markers were just the things. Very easy to use, easy to size, change the color. It was an affordable, perfect solution and I'm happy to recommend it.
Anonymous, US
The crisp, clean look of the graphics, and the fact that it allowed me to easily edit and change the colors to match the template was my main reason for purchasing them.
Brandie Jenkins, E-learning Developer, USA
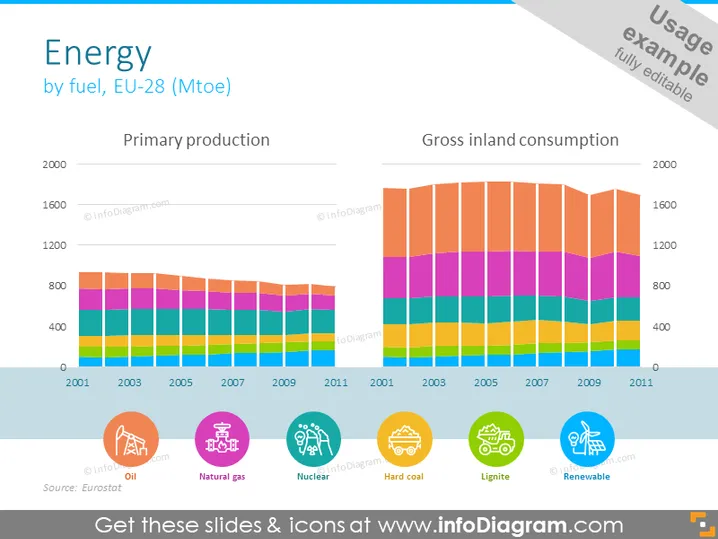
Die PowerPoint-Folie mit dem Titel "Energie nach Brennstoffen, EU-28 (Mtoe)" präsentiert Daten zur primären Produktion und dem Bruttoinlandsverbrauch von Energie über einen Zeitraum von 2001 bis 2011 in den 28 Mitgliedsländern der Europäischen Union. Die Folie vergleicht visuell die beiden Kategorien durch gestapelte Balkendiagramme und zeigt eine komplexe Mischung aus verschiedenen Energiequellen wie Öl, Erdgas, Kernenergie, Steinkohle, Braunkohle und erneuerbaren Energien. Jede Quelle ist farblich gekennzeichnet und proportional innerhalb jedes Balkens dargestellt, was einen klaren Einblick in den Energiemix und die Trends bietet.
Die Folie ist ordentlich organisiert und verwendet eine klare visuelle Sprache mit farblich gekennzeichneten Elementen, um Statistiken über die Energieproduktion und den -verbrauch zu vermitteln. Symbole werden effektiv eingesetzt, um das Verständnis auf einen Blick zu erleichtern.


