Your graphics add a nice touch to my presentations and I recently used them for one of my all-hands meetings. Your toolbox adds professionalism to my slides. Instead of using standard clipart.
Claude Jones, Director of Engineer, @Walmartlabs, USA
Your graphics add a nice touch to my presentations and I recently used them for one of my all-hands meetings. Your toolbox adds professionalism to my slides. Instead of using standard clipart.
Claude Jones, Director of Engineer, @Walmartlabs, USA
I needed a fresh look at some of my slides. I've tried to find a way to create a paintbrush effect, to underline, accentuate, add some color and the handwritten markers were just the things. Very easy to use, easy to size, change the color. It was an affordable, perfect solution and I'm happy to recommend it.
Anonymous, US
The crisp, clean look of the graphics, and the fact that it allowed me to easily edit and change the colors to match the template was my main reason for purchasing them.
Brandie Jenkins, E-learning Developer, USA
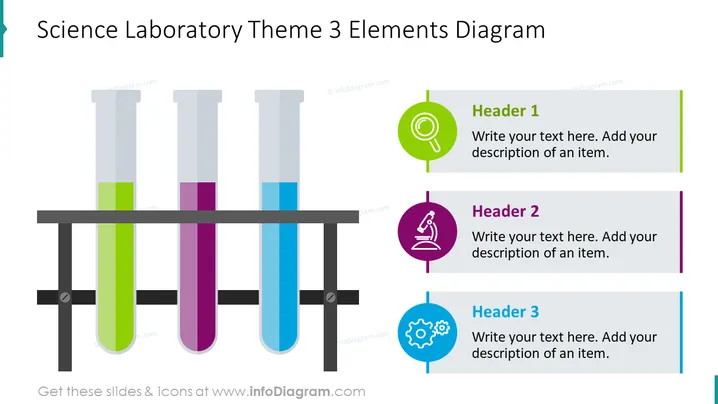
Die PowerPoint-Folie mit dem Titel "Wissenschaftslabor-Thema 3 Elemente Diagramm" zeigt ein stilisiertes Set von Laborverbrauchsgläsern neben drei zugehörigen Inhaltsblöcken. Jeder Inhaltsblock hat eine distinct farbige Überschrift (grün, lila, blau), ein Icon und Platzhaltertext für eine Beschreibung. Die grüne Überschrift repräsentiert "Überschrift 1" und weist auf das erste Element oder die erste Idee hin, mit einem Lupe-Icon, das für Prüfen oder Untersuchung steht. "Überschrift 2" in lila mit einem Mikroskop-Icon deutet auf einen Fokus auf Details oder eine genaue Analyse hin. Schließlich könnte "Überschrift 3" in blau, begleitet von einem Zahnrad-Icon, einen Prozess, ein System oder Mechaniken darstellen. Jede Überschrift lädt den Präsentierenden ein, diese drei unterschiedlichen Konzepte näher zu erläutern.
Die Folie hat ein modernes, sauberes Design mit starkem Fokus auf visueller Ausrichtung und thematischer Konsistenz. Die Verwendung von Farbkodierung zwischen den Verbrauchsgläsern und Inhaltsblöcken schafft einen intuitiven Fluss von grafischen zu textlichen Informationen.


