

Your graphics add a nice touch to my presentations and I recently used them for one of my all-hands meetings. Your toolbox adds professionalism to my slides. Instead of using standard clipart.
Claude Jones, Director of Engineer, @Walmartlabs, USA

Your graphics add a nice touch to my presentations and I recently used them for one of my all-hands meetings. Your toolbox adds professionalism to my slides. Instead of using standard clipart.
Claude Jones, Director of Engineer, @Walmartlabs, USA
I needed a fresh look at some of my slides. I've tried to find a way to create a paintbrush effect, to underline, accentuate, add some color and the handwritten markers were just the things. Very easy to use, easy to size, change the color. It was an affordable, perfect solution and I'm happy to recommend it.
Anonymous, US
The crisp, clean look of the graphics, and the fact that it allowed me to easily edit and change the colors to match the template was my main reason for purchasing them.
Brandie Jenkins, E-learning Developer, USA
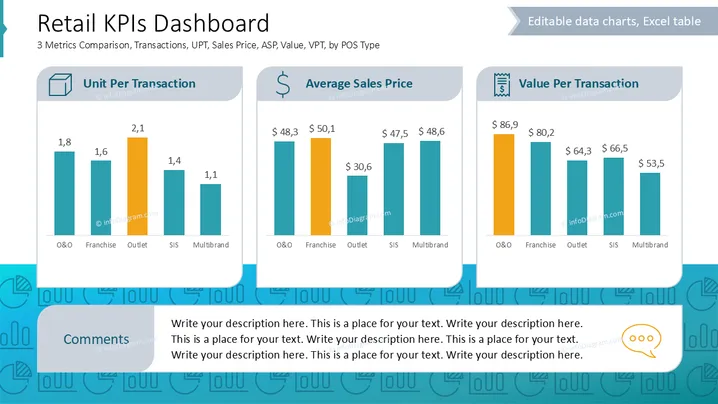
Die Folie bietet einen Vergleich von drei Einzelhandels-KPIs nach POS-Typ: Einheiten pro Transaktion (UPT), Durchschnittlicher Verkaufswert (ASP) und Wert pro Transaktion (VPT). UPT zeigt die durchschnittliche Anzahl der verkauften Einheiten pro Transaktion und hebt Outlet als die führende Kategorie hervor. ASP vergleicht den durchschnittlichen Preis, zu dem Waren verkauft werden, wobei Franchise den höchsten Wert hat. VPT misst den monetären Wert der Transaktionen, wobei O&O der beste Performer ist.
Der Gesamteindruck ist modern und organisiert, was eine einfache Dateninterpretation und ansprechende Präsentation erleichtert. Die Icons und Farben helfen, jede KPI-Fokuszone schnell zu unterscheiden.



