

Your graphics add a nice touch to my presentations and I recently used them for one of my all-hands meetings. Your toolbox adds professionalism to my slides. Instead of using standard clipart.
Claude Jones, Director of Engineer, @Walmartlabs, USA

Your graphics add a nice touch to my presentations and I recently used them for one of my all-hands meetings. Your toolbox adds professionalism to my slides. Instead of using standard clipart.
Claude Jones, Director of Engineer, @Walmartlabs, USA
I needed a fresh look at some of my slides. I've tried to find a way to create a paintbrush effect, to underline, accentuate, add some color and the handwritten markers were just the things. Very easy to use, easy to size, change the color. It was an affordable, perfect solution and I'm happy to recommend it.
Anonymous, US
The crisp, clean look of the graphics, and the fact that it allowed me to easily edit and change the colors to match the template was my main reason for purchasing them.
Brandie Jenkins, E-learning Developer, USA
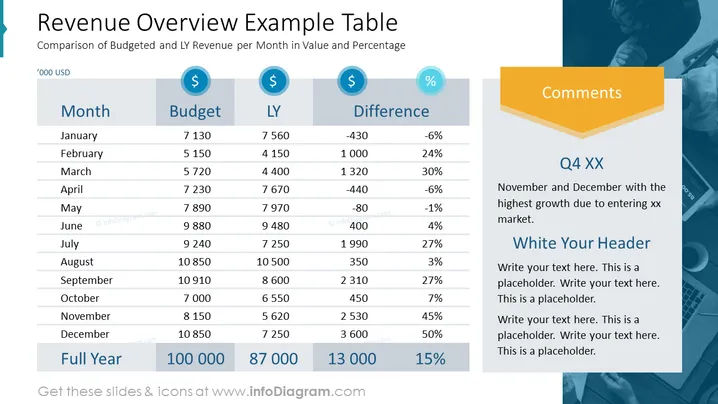
Die PowerPoint-Folie trägt den Titel "Einnahmenübersicht Beispiel Tabelle" und vergleicht die budgetierten Einnahmen mit den Einnahmen des letzten Jahres (LY) pro Monat, sowohl in Wert als auch in Prozent. Die Tabelle listet jeden Monat mit den entsprechenden budgetierten und LY-Einnahmen auf, zusammen mit den berechneten Unterschieden in Tausend USD. Hervorzuhebende Punkte sind markiert, wie das höchste Wachstum im November und Dezember, das auf den Eintritt in einen neuen Markt zurückzuführen ist. Der rechte Abschnitt mit dem Titel "Kommentare" enthält Platzhaltertext für zusätzliche Erklärungen.
Die Folie ist mit einer professionellen und sauberen Ästhetik gestaltet und kombiniert eine ausgewogene Farb- und Symbolverwendung, um wichtige Finanzdaten zu betonen. Die abwechselnden Farbzeilen und die eindeutige Zusammenfassungszeile verbessern die Lesbarkeit.



