
Your graphics add a nice touch to my presentations and I recently used them for one of my all-hands meetings. Your toolbox adds professionalism to my slides. Instead of using standard clipart.
Claude Jones, Director of Engineer, @Walmartlabs, USA

Your graphics add a nice touch to my presentations and I recently used them for one of my all-hands meetings. Your toolbox adds professionalism to my slides. Instead of using standard clipart.
Claude Jones, Director of Engineer, @Walmartlabs, USA
I needed a fresh look at some of my slides. I've tried to find a way to create a paintbrush effect, to underline, accentuate, add some color and the handwritten markers were just the things. Very easy to use, easy to size, change the color. It was an affordable, perfect solution and I'm happy to recommend it.
Anonymous, US
The crisp, clean look of the graphics, and the fact that it allowed me to easily edit and change the colors to match the template was my main reason for purchasing them.
Brandie Jenkins, E-learning Developer, USA
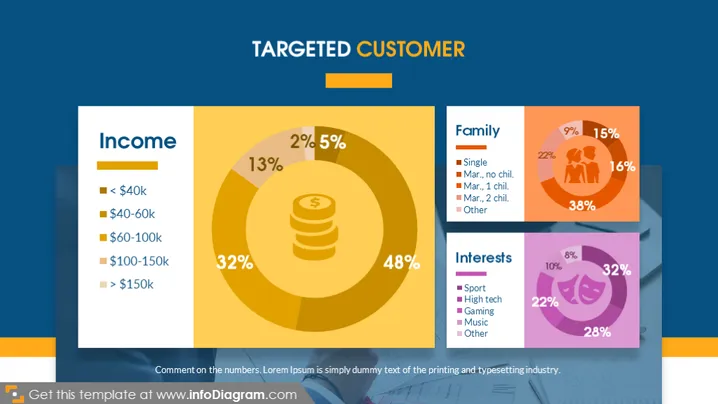
Die Folie präsentiert demografische Segmente einer Zielkundengruppe, unterteilt in die Bereiche Einkommen, Familienstruktur und Interessen. "Einkommen" zeigt fünf Kategorien mit prozentualer Aufschlüsselung – von weniger als 40.000 $ bis über 150.000 $, was unterschiedliche Einkommensniveaus anzeigt. "Familie" illustriert den Familienstand des Kunden und die Anzahl der Kinder, wobei Begriffe wie "Ledig" und "Verheiratet, 2 Kinder" für den Familienstand mit einem oder zwei Kindern verwendet werden. "Interessen" beschreibt die Vorlieben der Kunden mit bunten Tags für Sport, High Tech, Gaming, Musik und mehr, was Einblicke in verschiedene Freizeitaktivitäten und Präferenzen gibt.
Die Folie hat ein insgesamt modernes und sauberes Design mit einheitlichen Grafiken, die Informationen durch Farbcode und Symbole klar kategorisieren.