
Your graphics add a nice touch to my presentations and I recently used them for one of my all-hands meetings. Your toolbox adds professionalism to my slides. Instead of using standard clipart.
Claude Jones, Director of Engineer, @Walmartlabs, USA
Your graphics add a nice touch to my presentations and I recently used them for one of my all-hands meetings. Your toolbox adds professionalism to my slides. Instead of using standard clipart.
Claude Jones, Director of Engineer, @Walmartlabs, USA
I needed a fresh look at some of my slides. I've tried to find a way to create a paintbrush effect, to underline, accentuate, add some color and the handwritten markers were just the things. Very easy to use, easy to size, change the color. It was an affordable, perfect solution and I'm happy to recommend it.
Anonymous, US
The crisp, clean look of the graphics, and the fact that it allowed me to easily edit and change the colors to match the template was my main reason for purchasing them.
Brandie Jenkins, E-learning Developer, USA
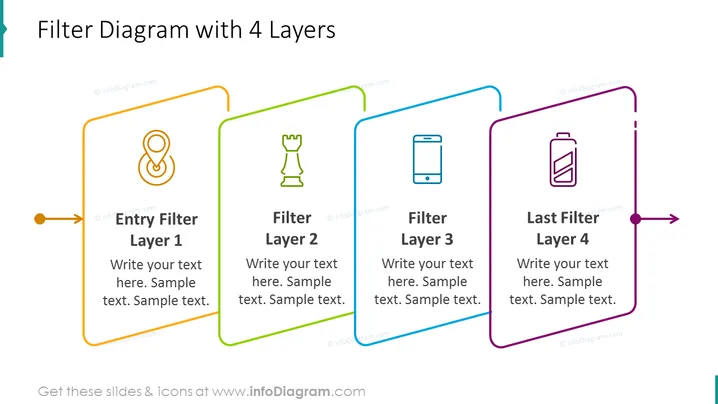
Die PowerPoint-Folie zeigt ein "Filterdiagramm mit 4 Schichten", das einen schrittweisen Prozess oder ein schichtweises Filtersystem darstellt. Jede Schicht ist mit einer einzigartigen Farbe und einem Symbol gekennzeichnet, die eine bestimmte Phase anzeigen. Schicht 1 ist der "Eingangsfilter", bei dem anfängliche Kriterien oder Eingaben angewendet werden, gefolgt von Schicht 2 als der zweiten Stufe der Filterung, dann Schicht 3 und schließlich wird Schicht 4 als "Letzter Filter" bezeichnet, was die letzte Phase des Prozesses impliziert. Jede Filterebene bietet Platz für Text, um zu erläutern, was jeder Filter bedeutet oder erreicht.
Die Folie verwendet ein sauberes und modernes Design mit lebendigen Farben, um zwischen den einzelnen Schritten des Filterprozesses zu unterscheiden. Die Symbole sind einfach und dennoch beschreibend und bieten visuelle Hinweise darauf, was jede Filterebene darstellt.




