Your graphics add a nice touch to my presentations and I recently used them for one of my all-hands meetings. Your toolbox adds professionalism to my slides. Instead of using standard clipart.
Claude Jones, Director of Engineer, @Walmartlabs, USA
Your graphics add a nice touch to my presentations and I recently used them for one of my all-hands meetings. Your toolbox adds professionalism to my slides. Instead of using standard clipart.
Claude Jones, Director of Engineer, @Walmartlabs, USA
I needed a fresh look at some of my slides. I've tried to find a way to create a paintbrush effect, to underline, accentuate, add some color and the handwritten markers were just the things. Very easy to use, easy to size, change the color. It was an affordable, perfect solution and I'm happy to recommend it.
Anonymous, US
The crisp, clean look of the graphics, and the fact that it allowed me to easily edit and change the colors to match the template was my main reason for purchasing them.
Brandie Jenkins, E-learning Developer, USA
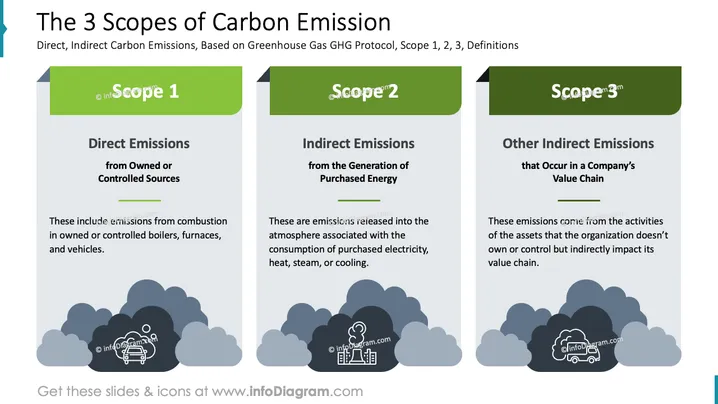
Die Folie beschreibt die drei Bereiche der Kohlenstoffemissionen basierend auf dem Treibhausgasprotokoll. Bereich 1 umfasst direkte Emissionen aus eigenen oder kontrollierten Quellen, wie die Verbrennung in Kesseln oder Fahrzeugen. Bereich 2 umfasst indirekte Emissionen aus der Erzeugung gekaufter Energie, einschließlich Strom und Wärme. Bereich 3 betrifft andere indirekte Emissionen, die in der Wertschöpfungskette eines Unternehmens auftreten und Aktivitäten von Vermögenswerten umfassen, die nicht im Besitz der Organisation sind.
Die Gesamtfolie ist klar und strukturiert und nutzt Farben und Symbole effektiv, um die drei Bereiche der Emissionen zu unterscheiden.


